


")
")
")


EFFECTIVENESS OF THERABAND EXERCISES VERSUS PILATES EXERCISES ALONG WITH BASIC ABDOMINAL EXERCISES IN REDUCTION OF ABDOMINAL BELLY – Dr. Divya Tiwari
EFFECTIVENESS OF THERABAND EXERCISES VERSUS PILATES EXERCISES ALONG WITH BASIC ABDOMINAL EXERCISES IN REDUCTION OF ABDOMINAL BELLY
Dr. Divya Tiwari, M.P.T Cardio, Asst. prof. D.P.T. JRNRVU
ABSTRACT
EFFECTIVENESS OF THERABAND EXERCISES VERSUS PILATES EXERCISES ALONG WITH BASIC ABDOMINAL EXERCISES IN REDUCTION OF ABDOMINAL BELLY
Background and Purpose: Abdominal obesity is when excessive abdominal fat around the stomach and abdomen has built up to the extent that may have a negative impact on health. The purpose of this study is to find out the better exercise protocol to reduce abdominal belly and to improve strength and endurance of abdominal muscles.
Materials and Method: Sixty adults (20-40 yrs of age) were evaluated through measuring tape and skin fold caliper. These subjects were conveniently allocated to one of the two groups: Group A (n=30) was administered with the theraband exercises along with the basic abdominal exercises and Group B (n=30) was administered with the pilates exercises along with the basic abdominal exercises.
Results: The Mean (SD) age is 34.40±3.39 (years) for Group A and the Mean (SD) age is 33.00±3.48 (years) for Group B. There was significant differences between Group A and Group B for the reduction of body fat percent, waist circumference, waist-hip ratio and improvement in abdominal muscle endurance (p<0.05) but there was no significant difference between Group A and B for strength improvement of abdominal muscle in the posttest (p>0.05).
Conclusion: There is a significant difference in the reduction of body fat percent, waist-hip ratio, waist circumference and improvement in the abdominal muscle endurance but no significant difference has been seen in muscle strength improvement of abdominal muscle between Group A and Group B.
Keywords: Abdominal Belly, Theraband Exercises and Pilates Exercises
Table of Contents
| CHAPTER | TITLE | PAGE NO. |
| 1 | INTRODUCTION | 1-9 |
| Introduction | 1-5 | |
| Need of the study | 6 | |
| Significance of the study | 6 | |
| Aims and Objectives | 6 | |
| Hypothesis | 6 | |
| Operational definitions | 7-9 | |
| 2 | REVIEW OF LITERATURE | 10-14 |
| 3 | MATERIALS AND METHODS | 15-30 |
| Study design | 15 | |
| Study Setting | 15 | |
| Population and Sampling | 15 | |
| Selection criteria | 15 | |
| Inclusion criteria | 15 | |
| Exclusion criteria | 15 | |
| Parameters | 16 | |
| Instruments and Tools | 16 |
| Procedure | 17-28 | |
| Statistical tools | 29-30 | |
| 4 | DATA ANALYSIS AND RESULTS | 31-50 |
| 5 | DISCUSSION | 51-55 |
| Limitations | 55 | |
| 6 | CONCLUSION AND FUTURE SCOPE OF THE STUDY | 56 |
| 7 | REFERENCES | 57-62 |
| 8 | APPENDICES | 63-72 |
| Appendice – 1 (Informed Consent) | 63 | |
| Appendice – 2 (Assessment Form) | 64-65 | |
| Appendice – 3 (Master Chart) | 66-69 | |
| Appendice – 4 (Treatment Protocol) | 70-71 | |
| Appendice – 5 (Assessment Tools) | 71-72 |
| LIST OF TABLES | PAGE NO. | |
| TABLE 4.1 | Depicts comparison of mean and SD of age of the subjects of Group A and Group B | 31 |
| TABLE 4.2 | Depicts comparison of mean and SD of body fat percent within the Group A and Group B | 32 |
| TABLE 4.3 | Depicts comparison of mean and SD of waist circumference within the Group A and Group B | 33 |
| TABLE 4.4 | Depicts comparison of mean and SD of waist-hip ratio within the Group A and Group B | 34 |
| TABLE 4.5 | Depicts comparison of mean and SD of strength within the Group A and Group B | 35 |
| TABLE 4.6 | Depicts comparison of mean and SD of endurance within the Group A and Group B | 36 |
| TABLE 4.7 | Depicts comparison of mean and SD of body fat percent for the subjects of Group A and Group B (Pre Readings) | 37 |
| TABLE 4.8 | Depicts comparison of mean and SD of body fat percent for the subjects of Group A and Group B (Post Readings) | 38 |
| TABLE 4.9 | Depicts comparison of mean and SD of waist circumference for the subjects of Group A and Group B (Pre Readings) | 39 |
| TABLE 4.10 | Depicts comparison of mean and SD of waist circumference for the subjects of Group A and Group B (Post Readings) | 40 |
| TABLE 4.11 | Depicts comparison of mean and SD of waist-hip ratiofor the subjects of Group A and Group B (Pre Readings) | 41 |
| TABLE 4.12 | Depicts comparison of mean and SD of waist-hip ratiofor the subjects of Group A and Group B (Post Readings) | 42 |
| TABLE 4.13 | Depicts comparison of mean and SD of strengthfor the subjects of Group A and Group B (Pre Readings) | 43 |
| TABLE 4.14 | Depicts comparison of mean and SD of strengthfor the subjects of Group A and Group B (Post Readings) | 44 |
| TABLE 4.15 | Depicts comparison of mean and SD of endurancefor the subjects of Group A and Group B (Pre Readings) | 45 |
| TABLE 4.16 | Depicts comparison of mean and SD of endurancefor the subjects of Group A and Group B (Post Readings) | 46 |
| LIST OF GRAPHS | PAGE NO. | |
| GRAPH 4.1 | Demonstrates the comparison of mean value and standard deviation of age between Group A and Group B | 31 |
| GRAPH 4.2 | Demonstrates the comparison of mean value and standard deviation of body fat percent within Group A and Group B | 32 |
| GRAPH 4.3 | Demonstrates the comparison of mean value and standard deviation of waist circumference within Group A and Group B | 33 |
| GRAPH 4.4 | Demonstrates the comparison of mean value and standard deviation of waist-hip ratio within Group A and Group B | 34 |
| GRAPH 4.5 | Demonstrates the comparison of mean value and standard deviation of strength within Group A and Group B | 35 |
| GRAPH 4.6 | Demonstrates the comparison of mean value and standard deviation of endurance within Group A and Group B | 36 |
| GRAPH 4.7 | Demonstrates the comparison of mean value and standard deviation of body fat percent between Group A and Group B for pre readings | 37 |
| GRAPH 4.8 | Demonstrates the comparison of mean value and standard deviation of body fat percent between Group A and Group B for post readings | 38 |
| GRAPH 4.9 | Demonstrates the comparison of mean value and standard deviation of waist circumference between Group A and Group B for pre readings | 39 |
| GRAPH 4.10 | Demonstrates the comparison of mean value and standard deviation of waist circumference between Group A and Group B for post readings | 40 |
| GRAPH 4.11 | Demonstrates the comparison of mean value and standard deviation of waist-hip ratio between Group A and Group B for pre readings | 41 |
| GRAPH 4.12 | Demonstrates the comparison of mean value and standard deviation of waist-hip ratio between Group A and Group B for post readings | 42 |
| GRAPH 4.13 | Demonstrates the comparison of mean value and standard deviation of strength between Group A and Group B for pre readings | 43 |
| GRAPH 4.14 | Demonstrates the comparison of mean value and standard deviation of strength between Group A and Group B for post readings | 44 |
| GRAPH 4.15 | Demonstrates the comparison of mean value and standard deviation of endurance between Group A and Group B for pre readings | 45 |
| GRAPH 4.16 | Demonstrates the comparison of mean value and standard deviation of endurance between Group A and Group B for post readings | 46 |
| LIST OF FIGURES | PAGE NO | |
| Figure 3.1 | Patient performing squat with theraband | 26 |
| Figure 3.2 | Patient performing lunges with theraband | 27 |
| Figure 3.3 | Patient performing four point kneeling with opposite arm and leg raise | 28 |
| Figure 8.5.1 | Skin caliper and Measuring tape | 72 |
| Figure 8.5.2 | Weighing machine | 72 |
INTRODUCTION
There are many important functions of abdominal muscles including coughing, breathing and sneezing. They also play a major role in maintaining the posture and speech in a number of species. There are four muscles which together forms the anterior abdominal wall. They are- Rectus abdominis, Internal and External obliques and Transverse abdominis. The internal oblique and the Transverse abdominis which are the Internal muscles of abdomen respond more to increase in chemical or volume related drive as compared to the Rectus abdominis and External oblique which are the external muscles of abdomen(1).
When unwarranted abdominal fat around the abdomen has built up to the level that it may cause a negative impact on the heath of a person is known as Abdominal obesity. The synonyms of abdominal obesity are beer belly, pot belly or central obesity(2).
Usually obesity is reported in body mass index (BMI) whereas abdominal obesity in waist circumference (WC). According to recent studies which used Indian specific criteria for abdominal obesity, the waist circumference should be more than 35.37 inches (90 cm) in men and 31.44 inches (80cm) in women(3,4).
Women have higher rates for abdominal obesity (women: 56% and men: 35%). Abdominal obesity was found with normal BMI among 5% of men and 14% of women which is known as isolated abdominal obesity(3).
Abdominal obesity does not occur only in elderly and obese people(5). A strong correlation has been found between the central obesity and cardiovascular diseases(6). It is also related to the Alzheimer‟s disease as well as other metabolic and vascular diseases(7). There is also a strong association of abdominal obesity and Type 2 diabetes(8) and high blood pressure, regardless of total body fat(9). There is a term known as Diabesity which refers to the obesity found in Type-2 diabetic patients which is a very common observable fact. Metabolic syndrome includes many conditions like obesity, diabetes and hypertension(10).
The proportion of obese women who are married between 15-49 years of age increased from 11% to 15% according to „National Family Health Survey‟(NFHS) from NFHS-2 to NFHS-3. Under nutrition is more prevailing in rustic areas whereas obesity in metropolitan areas. Lack of physical activity in urban areas may be one of the reason. The rate of under nutrition and obesity, both are higher for women than men(11).
Punjab is found to have the highest percentage of obese women(30%) followed by Kerala(28%) and then Delhi(26%)(12). The increase in generalized obesity is significantly correlated with the hypertension, hypercholesterolemia, metabolic syndrome and diabetes whereas truncal obesity is less strongly correlated with the above risk factors. Thus in Asian Indian people, the increasing cardiovascular risk factors is correlating strongly with the increasing generalized obesity(13).
The prevalence of overweight was higher among the urban areas as compared to urbanizing rural population. But there is a rapid change in the rural population regarding the living conditions which has improved a lot. Improved medical care, transport facilities, educational system and family income along with easy access to city resulted in the changes of lifestyle(14).
A study done in the year 1989 showed that these changes had led to a significant increase in BMI along with abdominal obesity in both males and females. Change in the life style of rural people was said to be a factor for the rising rates of obesity and associated metabolic diseases. The prevalence of obesity increased from 2% – 17.1%(14).
According to the India NFHS, the prevalence of overweight was less than the under nutrition in the country, as obesity was more amongst the urban and high socioeconomic status, generally in women. Because of the less physical activity and amplified intake of energy dense diet, there is an increase in the rate of obesity in urban areas in developing countries(14).
According to a survey which was done to check the obesity differences between males and females in sample of Indian population with 577 adults (270 males and 307 females) between 25-60 years of age in Delhi, India. The correlation was calculated between the systolic and diastolic blood pressure along with other indices of obesity(15).
The result of the survey showed that the rate of hypertension and pre-hypertension was high amongst males and the obesity rate was higher in females. There was a significant correlation between the blood pressure and all the indices of obesity(15).
In a comparison of the two studies conducted by NFHS-2 in 1998-1999 and NFHS-3 in 2005- 2006, there was an increased prevalence of obesity among Indian women specially of the age between 40-49 years (23.7%), who lives in a city (23.5%), have a high qualification (23.8%) and
belonging to Sikh community (31.6%). The problem of under nutrition is still present in India while the additional burden of obesity is really alarming in economically good areas(16).
The incidence of the disorders related to the standard of living changes in India is of concern that occurs either individually or in a combination. Increased tendency to premature coronary artery disease (CAD) and diabetes in Indians has been certified to the Asian Indian Phenotype which is characterized by less generalized obesity which is measured in terms of BMI and abdominal obesity by more waist circumference and waist-hip ratio(17).
In spite of having a lean BMI, an Indian adult has more probability of having central obesity. Indians have appreciably higher body fat percentage than a western with the same blood glucose level and BMI. It can be concluded that less muscle mass and increased body fat may explain the high risk of type-2 diabetes and high prevalence of hyperinsulinemia in Asian Indians(18).
The powerful and perceptive imaging techniques were discovered in the late 1980s and early 1990s that would help to progress our understanding about the health risks related with the buildup of the body fat. Techniques like CT Scan and MRI imaging made it possible to classify mass of adipose tissue located at the abdominal level into intra abdominal fat and subcutaneous fat(19).
Abdominal muscles can be built through the abdominal exercises which is essential for improving the performance with certain sports, back pain and for withstanding abdominal impacts like taking punches. A study was done in 2011 which showed that abdominal exercises increases the strength and endurance of the abdominal muscles(20).
In order to prevent obesity, regular physical activity is very important. It helps in improving the health and decreasing the visceral and abdominal subcutaneous adipose tissue. Specific training programs have resulted in the change in body composition. Endurance training along with resistance training helps in improving the body composition by reducing the fat mass and increasing the total lean mass(21).
A similar study done in the year 2006 showed that the abdominal exercises reduced the size of the subcutaneous abdominal fat cells as Type-2 diabetes is predicted by the size of a cell.
Moderate exercises helped to decrease the cell size by 18% in about 45 obese females over a 20 weeks period whereas diet alone did not found to be as effective to reduce the cell size(20).
A study showed that the indicators of metabolic syndrome can be improved like decrease in the blood sugar level and insulin level and increase in the physical fitness by performing the combined exercises which includes the resistance exercises and aerobic exercises for a middle aged women(22).
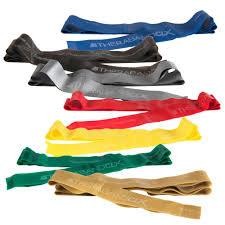
Theraband exercises has proved to increase the strength, mobility and function along with the decrease in the joint pain(75). Therabands are colour coded bands which shows the level of resistance and according to it we can plan a treatment program depending upon an individual‟s strength. Change in the colour of the band signifies the progress and improvement in the strength of muscles(23).
There are studies which shows that the visceral adipose tissue(VAT) can be decreased in obesity independent of weight loss through the exercises(24,25). The recent studies showed that the increase in the muscle mass can be attained through resistance training which helps in decreasing the insulin resistance(26), blood lipid profiles are also improved in obese patients with diabetes and cardiovascular diseases(27,28) and it also decreases the visceral fat(29).
Resistance band training improves the strength of a person according to the personal physical condition and provides a proper and individualized load by increasing the band resistance gradually as the muscle strength increases. Along with it, resistance band training is also found to be an effective exercise protocol in order to increase the muscle strength without putting much stress on each muscle or joint(30,31).
Pilates exercises are a form of body mind exercises where the focus is on the controlled movement , posture and breathing(32). They help in improving the flexibility, strength and endurance in human body as a whole(33). Pilates system allows the modification of different exercises by increasing their difficulty level form beginning to advanced. Intensity of the exercises can be increased as the body conditions adapts to the exercises(76).
Pilates builds endurance within individual exercises and also within workouts. These exercises focus on improving one‟s concentration in order to build the strength for both whereas endurance
is improved from mental strength and therefore require determination and persistence. Pilates strengthens the complete body targeting each muscle group with a mixture of dynamic and static strength training evenly. The muscles work from many different directions causing a uniform and very deep strength and tone even without using heavy weights (34).
Need of the study
No study has been done to compare the theraband and pilates exercises in reduction of abdominal belly, so present study was designed to find out the better exercise protocol to reduce abdominal belly and to improve strength and endurance of abdominal muscles.
Significance of the study
This research will help in giving some concrete baseline information about the effectiveness of theraband exercises versus pilates exercises in the reduction of abdominal belly and improving the abdominal muscles strength and endurance.
Aims and Objectives
- To find out the effectiveness of theraband exercises in reduction of abdominal belly and improving abdominal muscles strength and endurance.
- To find out the effectiveness of pilates exercises in reduction of abdominal belly and improving abdominal muscles strength and endurance.
- To compare the effectiveness of theraband exercises and pilates exercises in reduction of abdominal belly and improving abdominal muscles strength and endurance.
Hypothesis
Alternative hypothesis
There is significant difference between theraband exercises and pilates exercises in reducing the abdominal belly and improving the abdominal muscles strength and endurance.
Null hypothesis
There will be no significant difference between theraband exercises and pilates exercises in reducing the abdominal belly and improving the abdominal muscles strength and endurance.
Muscular endurance
It can be defined as the ability of a muscle in order to perform low intensity, repetitive or sustained activities over a prolonged period of time(35).
Theraband
Resistive exercises has proved to increase the strength, mobility and function along with the pain in the joint(75). Therabands come in colour-coded resistance levels so we can plan a program and select the suitable resistance level. Colour change shows our progress, as we work our way through the different levels(23).
| Colour | Resistance |
| Tan | extra thin Thin Medium Heavy extra heavy
special heavy super heavy |
| Yellow | |
| Red | |
| Green | |
| Blue | |
| Black | |
| Silver |
Pilates exercises
They are a set of body mind exercises which focus on a controlled movement, posture and breathing(32). They progress flexibility, develops control and endurance and builds strength(33). Exercises can be modified from beginning to highly developed level of difficulty. As body conditions adapt to the exercises, the intensity of the exercises can be increased(76).
There were original six principles of pilates which includes concentration, control, center, flow, precision, and breathing(36).
Concentration
Intense focus is demanded in Pilates. Concentrate on what is done all the time and on your body for the smooth movements. The technique of exercises done is more important than the exercises themselves(37).
Control
All the exercises should be done with control with the muscles functioning against the gravity to lift(38).
Centering
To control the body during the exercises, starting place is needed: the center. The center a crucial point of the Pilates Method(39).
Flow or efficiency of movement
The aim of Pilates for the adequacy of movement, causing the flow during the use of appropriate transitions. Once accuracy has been achieved, the exercises are intended to flow within and into each other in order to build strength and stamina(40).
Precision
Precision is necessary to correct Pilates: concentrate on the proper movements each time you exercise, if you do them improperly and you lose all the vital benefits of their value (41).
Breathing
Breathing is essential in the Pilates method. Pilates saw the forced exhalation as the key to full inhalation. In Pilates exercises, the practitioner breathes out with the effort and in on the return(42).
Body fat percent
It is measured with the help of skin fold caliper. The skin fold thickness is taken from three sites and then put into the formula to measure body fat percent(43). Formula for calculating body density is-
Men-
Three-Site Formula (chest, abdomen, thigh)
Body Density = 1.10938 – 0.0008267 (sum of three skinfolds) + 0.0000016 (sum of three skin folds)2 – 0.0002574 (age)
Women-
Three-Site Formula (triceps, suprailiac, abdominal)
Body Density = 1.089733 – 0.0009245 (sum of three skin folds) + 0.0000025 (sum of three skin folds)2 – 0.0000979 (age)
Formula for calculating body fat percent-
% Body Fat = 495/BD – 450
MATERIALS and METHODS
Study Design
Comparative study
Study Setting
Family Physiotherapy wellness and rehabilitation centre, Thokar, Udaipur, Rajasthan.
Population and Sampling
Normal sedentary people with varying Body Mass Index (BMI) were taken. A sample of convenience of sixty adults took part in this study. Subjects who fulfilled the inclusion criteria and were ready to attend the exercise program regularly were selected. Subjects were divided into two groups- group A (n=30) and group B (n=30).
Selection Criteria
Inclusion criteria
- Waist circumference should be 35 inches in Males and 31 inches in Females.
- Healthy asymptomatic adults of age 20-40 years (males and females)
- Community dwelling adults and not institutionalized or hospitalized.
- Subjects who are able to ambulate independently without assistive devices.
Exclusion criteria
- Unstable and limiting cardiac disease, history of cardiac surgery
- History of Neurological disease with residual impairments
- Permanent history of dizziness.
- Subjects who had uncorrected hearing or visual impairment.
- Subjects who were receiving physical therapy or any exercise programme at the same time.
- Irregular to attend the exercise programme.
Parameters
- Body fat percent
- Waist Circumference
- Waist-Hip ratio
- Strength of abdominal muscles
- Endurance of abdominal muscles
Instruments and Tools
- Standardized measuring tape
- Skin fold caliper – It is usually the least expensive and is generally available. The specific areas of skin are pinched( and fat) all through the body and then converted to body fat percentage.
The reliability coefficients ranged from 0.62 to 0.85 for the individual sites and from 0.79 to 0.91 for the sums of the three measurements and for the estimates of the percentage of body fat(68).
- Weighing machine
- Therabands
Procedure
The study was designed in which 60 subjects with significant abdominal belly were included in the study after taking a consent form from them. Subjects were assessed for the inclusion and exclusion criteria and were divided into 2 groups – group A and group B by convenient sampling.
Group A received theraband exercises along with basic abdominal exercises and Group B received pilates exercises along with basic abdominal exercises.
The pretest readings of body fat percent, waist circumference, waist-hip ratio, abdominal strength and endurance were recorded before giving the intervention. Then the intervention was given for eight weeks; 3 days a week. After the intervention posttest readings of body fat percent, waist circumference, waist-hip ratio, abdominal strength and endurance were recorded and compared.

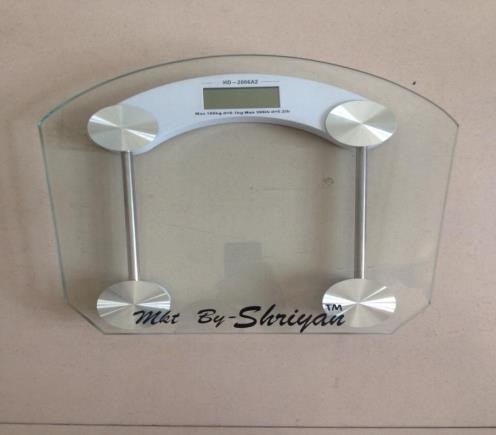 Figure 8.5.1- showing the skin caliper and measuring tape
Figure 8.5.2– Weighing machine
TOTAL SUBJECTS
68
1 subject was excluded as he did not met the inclusion criteria
GROUP A 33
GROUP B 34
Intervention is of 8 weeks, 3 sessions per week
4 Subjects left because of inability to attend the protocol
3 Subjects left because of
inability
program
to
attend the
Body
Waist
fat
percent,
circumference,
Waist-Hip ratio,
Strength and Endurance
Total Number of Subjects Group A–30
PRE TEST
Body fat percent, Waist circumference, Waist-Hip ratio, Strength and Endurance
Total Number of Subjects Group B –30
PRE TEST
Abdominal Exercises along with Basic Abdominal Exercises
Pilates Exercises along with Basic Abdominal Exercises
Group A – 30
POST TEST
Group B – 30 POST TEST
Group A : Theraband exercises
| Serial no. | Theraband
exercises |
Repetitions |
| 1 | Lunge | 10 |
| 2 | Squat | 10 |
| 3 | Lower Abdominal
Crunch |
10 |
| 4 | Trunk Curl- up | 10 |
| 5 | Side Bend | 10 |
Lunge
- Lie the band on the floor and stand in the middle of the band with one foot. The ends of the band is grasped around the hands at the chest level with the elbows slightly bent.
- The other leg should be placed behind with knee slightly bent.
- Bent the front knee while keeping the trunk straight and then lower the body downward.
- Return to the upright position slowly and then repeat it again.
Squat
- Stand upright on both legs.
- The band is placed under the feet.
- The ends of the band is held in both the hands with elbow straight.
- Knees to be bent upto 90º.
- In order to put more tension, pull the band.
- Then the knees are straightened.
- Repeat it slowly.
Lower Abdominal Crunch
- Lie on your back keeping both the knees and hips flexed. Take the band stretching it over the knees and then cross it beneath.
- The ends of the band are held in both the hands keeping the elbow straight and arms at the sides.
- Hips are lifted upward off the floor along with the knees.
- Hold the position and then return to the starting position slowly.
Trunk Curl-up
- The ends of the band are firmly fixed to a still entity near the floor.
- With the knees bent, lie on the floor and holding the ends of the band in both the hands with the elbow straight and arms in front.
- Lift the shoulder blades off the floor, curling the trunk upward while keeping both the hands together.
- Hold the position and then return slowly to the starting position.
Side Bend
- If we are bending towards the left side, then stand upright with one end of the band under the right foot and the other end grasped around hand of the same side.
- While keeping the elbow straight bent towards the left side.
- Then return to the starting position and repeat again.
Group B : Pilates exercises
| Serial no. | Pilates exercises | Repetitions |
| 1 | Double Leg Stretch | 10 |
| 2 | Mat Roll up | 5 |
| 3 | Four Point Kneeling Opposite Arm & Leg Raise | 10 |
| 4 | Upper Body
Extension (Dart) |
10 |
| 5 | Criss Cross | 10 |
Double Leg Stretch
-
- Lie on your back keeping the legs straight. Arms should be rested along the sides and the shoulders should touch the ground.
- Draw abs and inhale deeply. Bend the head forward till the chin rests on the chest and at the same time lift both the legs for about 2-6 inches from the floor. Take both the arms above the head in line with the ears.
- During exhalation, bring both the knees towards the chest grasping around with both the hands.
- Then again go for inhalation and return to the extended position.
Mat – Roll Up
-
- Keeping both the arms in extended position above the head, lie down on your back.
- Then inhale deeply and lift the arms above the floor and then exhale and sway into a C curve.
- Inhale while returning back to the extended position.
Four Point Kneeling Opposite Arm & Leg Raise
-
- The starting position is a four point kneeling position. Draw the abdominals and inhale.
- Extend one leg behind and exhale simultaneously. Keep the trunk straight. Extend the leg as much possible, then gently bring the leg to the starting position and inhale.
- After the 5 leg lifts on each side, lift the arm at the same time. If the left leg is lifted then simultaneously lift the right arm.
- Maintain the position along with the drawing of the abdominals.
Upper Body Extension (Dart)
-
- Lie on front with forehead touching the mat.
- Arms are relaxed at the sides.
- Lift the navel from the mat along with the hands and reach to the wall behind.
- While lifting the chest inhale.
Criss Cross
-
- Lie on the floor with both the knees extended and arms resting at the sides. Shoulders are relaxed completely.
- Inhale while drawing the abdominals and bent both the knees in such a position that both the knees make an angle of 90º.
- Consign the hands behind your head, elbows should be straight. Lift the head forward such that the shoulder blades lift off the floor.
- Deeply exhale and then extend the left leg keeping it raised off the mat. Rotate the trunk towards right in such a way that the left armpit reaches towards the right knee.
- Inhale while coming back to the starting position.
- Repeat it with the opposite leg.
Group A and B: Basic Abdominal exercises
| Serial no. | Abdominal exercises | Repetitions | Hold time |
| 1 | Pelvic Tilting | 10 | 5 sec. |
| 2 | Partial Abdominal Curls | 10 | 3 sec. |
| 3 | Diagonal Abdominal Curls | 10 | 3 sec. |
| 4 | Lower Abdominal
Exercise |
10 | 5 sec. |
We will increase the number of sets to 3 as the lower abdominal muscles become stronger.
Pelvic Tilting
-
- Lie on back with both the knees bent and feet flat on the floor.
- Lightly draw the abdominal muscles in order to press the arch of the back into the floor.
- This position is held for 5 seconds.
- Repeat it for 10 times.
Partial Abdominal Curls
-
- Lie straight with the back on the floor, both the knees bent and feet flat on the floor.
- Grasp both the hands behind the neck with both the elbows straight.
- Gradually lift the shoulder blades off the floor and tighten the abdominal muscles. The neck should not bend.
- The position is held for 3 seconds.
- Then slowly return to the starting position.Slowly
- Repeat this for 10 times.
Diagonal Abdominal Curls
-
- Lift the shoulder blades off the floor keeping the abdominal muscles tight and then rotate the trunk towards left side.
- Hold this position for 3 seconds.
- Return to the starting position slowly.
- Repeat this with the rotation towards the opposite side.
- Repeat this for 10 times on each side.
Lower Abdominal Exercise
-
- Lie on back with both the knees bent and feet flat on the floor.
- The feet are lifted off the floor in such a way that the knees face the ceiling.
- Lower the right foot slowly that it hardly touches the floor.
- Again bring the right foot back up.
- Repeat this with the other foot for 10 times with each foot.
 Figure 3.1- Patient performing squat with the theraband


Figure3.2- Patient performing lunges with the theraband
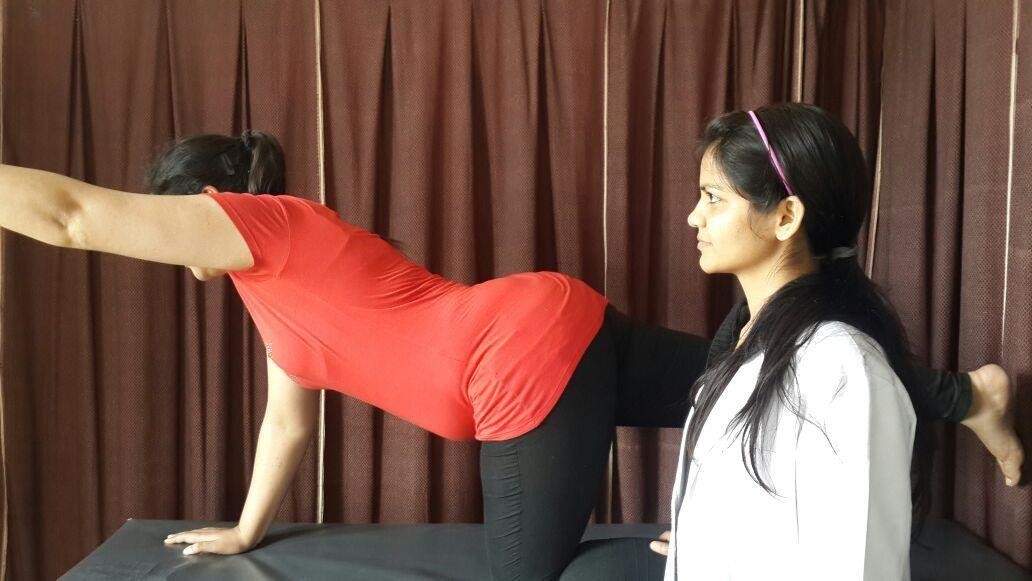 Figure3.3- Patient performing four point kneeling with opposite arm and leg raise
Statistical Tool
Statistics were performed using SPSS 19 software. To analyze the difference between the reduction of the abdominal belly in Group A and Group B, a student‟s t-test was used. Intra- group analysis between the pre intervention and post intervention scores was also done for both the groups. A significance level of p < 0.05 was fixed.
Mean: Using statistical formula for the mean, for a given number of subjects, mean of different age groups and parameters were calculated by:
X¯ =ΣX/n
Where, n= number of subjects X=each subjects value
Standard deviation (σ):
s= √∑x2/N
x = deviation of score from mean N= number of subjects
Paired t-test: For within group comparison Formula :
t=( X¯ D-μ0)/(sD/ )
XD= average
sD= standard deviation μ0=constant
Unpaired t-test : for between group analysis Formula :
t= X¯ 1– X¯ 2/SX1X2 . √1/𝑛1+1/n2
SX1X2=standard deviation
n1 = number of participants in group 1 n2 = number of participants in group 2
DATA ANALYSIS AND RESULTS
Table 4.1: Mean and SD of age for the subjects of Group A and Group B
| Variable | Group | Mean | S.D. | t- value | P value | Result |
| Age | Group A | 34.40 | 3.390 | 1.580 | 0.1201 | Not- Significant |
| Group B | 33.00 | 3.484 |
Comparison of mean and standard deviation of subject‟s age between the Group A (Theraband exercises Group) and Group B (Pilates exercises Group). The mean age of group A was 34.40±3.39 and that of group B was 33.00±3.48 respectively. The unpaired t test value was 1.580 (p>0.05). There was no significant difference in the age group.
Comparison of Age within the Group
Mean SD
40.00
35.00
30.00
25.00
20.00
15.00
10.00
5.00
0.00
34.40
33.00
3.390
3.484
Group A Group B
Age
Demographic Variables Comparison
Graph 4.1: Demonstrates the comparison of mean value and standard deviation of age between Group A and Group B.
Table 4.2: Mean and SD of body fat percent within the Group A and Group B
| Body fat percent | Mean±SD | t- Value | P Value | Result | |
| Group A | Pre Test | 34.37±1.732 | 22.100 | 0.0000 | Significant |
| Post Test | 29.03±2.220 | ||||
| Group B | Pre Test | 34.10±2.074 | 23.010 | 0.0000 | Significant |
| Post Test | 30.67±2.040 | ||||
Paired T Test was done to check the changes within the groups (Group A and Group B). For Group A mean and S.D value of body fat percent for Pre Test was 34.37±1.732 and for Post Test was 29.03±2.220. For Group B, mean and S.D values of body fat percent for Pre Test was 34.10±2.074 and for Post Test was 30.67±2.040. The results for the variables were significant which showed that there was significant changes within the Group A and Group B.


![]()
![]()
![]()
![]()
![]()
![]() Comparison of Body Fat Percent within the Group
Comparison of Body Fat Percent within the Group
Mean S.D.
40.00
34.37 34.10
35.00
30.67
30.00
29.03
25.00
20.00
15.00
10.00
5.00
1.732
2.220
2.074
2.040
0.00
Pre
Post
Pre
Post
Group A
Group B
Body Fat Percent(in %)
Graph 4.2: Demonstrates the comparison of mean value and standard deviation of body fat percent within the Group A and Group B.
Table 4.3: Mean and SD of waist circumference within the Group A and Group B
| Waist circumference | Mean±SD | t- Value | P Value | Result | |
| Group A | Pre Test | 35.79±1.674 | 9.940 | 0.0000 | Significant |
| Post Test | 33.15±2.319 | ||||
| Group B | Pre Test | 35.79±1.973 | 8.750 | 0.0000 | Significant |
| Post Test | 34.48±1.953 | ||||
Paired T Test was done to check the changes within the groups (Group A and Group B). For Group A mean and S.D values of waist circumference for Pre Test was 35.79±1.674 and for Post Test was 33.15±2.319. For Group B, mean and S.D values of waist circumference for Pre Test was 35.79±1.973 and for Post Test was 34.48±1.953. The results for the variables were significant which showed that there was significant changes within the Group A and Group B.


![]()
![]()
![]()
![]()
![]()
![]() Comparison of Waist Circumference within the Group
Comparison of Waist Circumference within the Group
MEAN SD
40.00
35.79
35.00
35.79
33.15
34.48
30.00
25.00
20.00
15.00
10.00
5.00
1.674
2.319
1.973
1.953
0.00
Pre
Post
Pre
Post
Group A
Group B
Waist Circumference(in inches)
Graph 4.3: Demonstrates the comparison of mean value and standard deviation of waist circumference within the Group A and Group B.
Table 4.4: Mean and SD of waist-hip ratio within the Group A and Group B
| Waist-Hip ratio | Mean±SD | t- Value | P Value | Result | |
| Group A | Pre Test | 1.51±0.237 | 12.050 | 0.0000 | Significant |
| Post Test | 1.00±0.080 | ||||
| Group B | Pre Test | 1.56±0.219 | 6.670 | 0.0000 | Significant |
| Post Test | 1.29±0.205 | ||||
Paired T Test was done to check the changes within the groups (Group A and Group B). For Group A mean and S.D values of waist-hip ratio for Pre Test was 1.51±0.237 and for Post Test was 1.00±0.080. For Group B, mean and S.D values of waist-hip ratio for Pre Test was 1.56±0.219 and for Post Test was 1.29±0.205. The results for the variables were significant which showed that there was significant changes within the Group A and Group B.


![]()
![]()
![]()
![]()
![]()
![]() Comparison of Waist-Hip Ratio within the Group
Comparison of Waist-Hip Ratio within the Group
MEAN sd
1.80
1.60
1.51
1.56
1.40
1.29
1.20
1.00
1.00
0.80
0.60
0.40
0.237
0.219
0.205
0.20
0.080
0.00
Pre
Post
Pre
Post
Group A
Group B
Waist-Hip ratio
Graph 4.4: Demonstrates the comparison of mean value and standard deviation of waist- hip ratio within the Group A and Group B.
Table 4.5: Mean and SD of strength within the Group A and Group B
| Strength | Mean±SD | t- Value | P Value | Result | |
| Group A | Pre Test | 3.60±0.93 | 8.120 | 0.0000 | Significant |
| Post Test | 4.90±0.66 | ||||
| Group B | Pre Test | 3.73±0.98 | 9.950 | 0.0000 | Significant |
| Post Test | 4.97±0.81 | ||||
Paired T Test was done to check the changes within the groups (Group A and Group B). For Group A mean and S.D values of strength for Pre Test was 3.60±0.93 and for Post Test was 4.90±0.66. For Group B, mean and S.D values of strength for Pre Test was 3.73±0.98 and for Post Test was 4.97±0.81. The results for the variables were significant which showed that there was significant changes within the Group A and Group B.


![]()
![]()
![]()
![]()
![]()
![]() Comparison of Strength within the Group
Comparison of Strength within the Group
mean SD
6.00
4.97
5.00
4.90
4.00
3.60
3.73
3.00
2.00
0.93
0.98
1.00
0.66
0.81
0.00
Pre
Post
Pre
Post
Group A
Group B
Strength(grade)
Graph 4.5: Demonstrates the comparison of mean value and standard deviation of strength within the Group A and Group B.
Table 4.6: Mean and SD of endurance within the Group A and Group B
| Endurance | Mean±SD | t- Value | P Value | Result | |
| Group A | Pre Test | 5.57±0.858 | 13.760 | 0.0000 | Significant |
| Post Test | 7.87±1.074 | ||||
| Group B | Pre Test | 5.20±1.031 | 9.250 | 0.0000 | Significant |
| Post Test | 7.10±1.213 | ||||
Paired T Test was done to check the changes within the groups (Group A and Group B). For Group A mean and S.D values of endurance for Pre Test was 5.57±0.858 and for Post Test was 7.87±1.074. For Group B, mean and S.D values of endurance for Pre Test was 5.20±1.031 and for Post Test was 7.10±1.213. The results for the variables were significant which showed that there was significant changes within the Group A and Group B.


![]()
![]()
![]()
![]()
![]()
![]() Comparison of Endurance within the Group
Comparison of Endurance within the Group
Mean SD
9.00
8.00
7.00
6.00
5.00
7.10
5.57
5.20
4.00
3.00
2.00
1.00
0.858
1.074
1.031
1.213
0.00
Pre
Post
Pre
Post
Group A
Group B
Endurance(per min)
7.87
Graph 4.6: Demonstrates the comparison of mean value and standard deviation of endurance within the Group A and Group B.
Table 4.7: Mean and SD of body fat percent for the subjects of Group A and Group B (Pre Readings)
| Pre test | Group | Mean | S.D. | t- value | P value | Result |
| Body Fat
Percent (in %) |
Group A | 34.37 | 1.732 | 0.540 | 0.5908 | Not- Significant |
| Group B | 34.10 | 2.074 |
Comparison of mean and standard deviation of body fat percent between the pre readings of Group A and Group B. The mean of body fat percent of group A was 34.37±1.73 and of group B was 34.10±2.07 respectively. The unpaired t- test value was 0.540 (p>0.05). There was no significant difference in the body fat percent between the groups.

Comparison of Body Fat Percent between the Groups (Pre Readings)
40.00
35.00
30.00
25.00
20.00
34.37
15.00
10.00
5.00
0.00
1.732
2.074
Group A Group B
Body Fat Percent(in %)
34.10
Mean SD
Graph 4.7: Demonstrates the comparison of mean value and standard deviation of body fat percent between Group A and Group B.
Table 4.8: Mean and SD of body fat percent for the subjects of Group A and Group B (Post Readings)
| Post test | Group | Mean | S.D. | t- value | P value | Result |
| Body Fat Percent
(in %) |
Group A | 29.03 | 2.220 | 2.970 | 0.0044 | Significant |
| Group B | 30.67 | 2.040 |
Comparison of mean and standard deviation of body fat percent between the post readings of Group A and Group B. The mean of body fat percent of group A was 29.03±2.22 and of group B was 30.67±2.04 respectively. The unpaired t- test value was 2.970 (p<0.05). There was significant difference in the reduction of body fat percent between the groups.


![]()
![]()
Comparison of Body Fat Percent between the Group (Post Readings)
MEAN SD
35.00
30.67
30.00
29.03
25.00
20.00
15.00
10.00
5.00
2.220
2.040
0.00
Group A
Group B
Body Fat Percent(in %)
Graph 4.8: Demonstrates the comparison of mean value and standard deviation of body fat percent between Group A and Group B.
Table 4.9: Mean and SD of body fat percent for the subjects of Group A and Group B (Pre Readings)
| Pre test | Group | Mean | S.D. | t- value | P value | Result |
| Waist Circumference
(in inches) |
Group A | 35.79 | 1.674 | 0.010 | 0.9944 | Not-Significant |
| Group B | 35.79 | 1.973 |
Comparison of mean and standard deviation of waist circumference between the pre readings of Group A and Group B. The mean of waist circumference of group A was 35.79±1.67 and of group B was 35.79±1.97 respectively. The unpaired t- test value was 0.010(p>0.05). There was no significant difference in the waist circumference between the groups.

Comparison of Waist Circumference between the Group (Pre Readings)
40.00
35.79
35.79
35.00
30.00
25.00
20.00
15.00
10.00
5.00
0.00
Group A
Group B
Waist Circumference(in inches)
Mean SD
1.973
1.674
Graph 4.9: Demonstrates the comparison of mean value and standard deviation of waist circumference between Group A and Group B.
Table 4.10: Mean and SD of waist circumference for the subjects of Group A and Group B (Post Readings)
| Post test | Group | Mean | S.D. | t- value | P value | Result |
| Waist Circumference
(in inches) |
Group A | 33.15 | 2.319 | 2.400 | 0.0195 | Significant |
| Group B | 34.48 | 1.953 |
Comparison of mean and standard deviation of waist circumference between the post readings of Group A and Group B. The mean of waist circumference of group A was 33.15±2.32 and of group B was 34.48±1.95 respectively. The unpaired t- test value was 2.400(p<0.05). There was significant difference in the reduction of waist circumference between the groups.


![]()
![]()
Comparison of Wiast Circumference between the Group (Post Readings)
40.00
35.00
Mean SD
33.15
34.48
30.00
25.00
20.00
15.00
10.00
5.00
2.319
1.953
0.00
Group A
Group B
Waist Circumference(in inches)
Graph 4.10: Demonstrates the comparison of mean value and standard deviation of waist circumference between Group A and Group B.
Table 4.11: Mean and SD of waist-hip ratio for the subjects of Group A and Group B (Pre Readings)
| Pre test | Group | Mean | S.D. | t- value | P value | Result |
| Waist-Hip ratio | Group A | 1.51 | 0.237 | 0.900 | 0.3727 | Not- Significant |
| Group B | 1.56 | 0.219 |
Comparison of mean and standard deviation of waist-hip ratio between the pre readings of Group A and Group B. The mean of waist-hip ratio of group A was 1.51±0.24 and of group B was 1.56±0.21respectively. The unpaired t- test value was 0.900(p>0.05). There was no significant difference in the waist-hip ratio between the groups.

Comparison of Wais-Hip Ratio between the Group (Pre Readings)
1.80
1.60
1.40
1.20
1.00
0.80
0.60
0.40
0.20
0.00
1.51
1.56
Group A Group B
Waist-Hip ratio
Mean SD
0.219
0.237
Graph 4.11: Demonstrates the comparison of mean value and standard deviation of waist- hip ratio between Group A and Group B.
Table 4.12: Mean and SD of waist-hip ratio for the subjects of Group A and Group B (Post Readings)
| Post test | Group | Mean | S.D. | t- value | P value | Result |
| Waist- Hip ratio | Group A | 1.00 | 0.080 | 7.340 | 0.0000 | Significant |
| Group B | 1.29 | 0.205 |
Comparison of mean and standard deviation of waist-hip ratio between the post readings of Group A and Group B. The mean of waist-hip ratio of group A was 1.00±0.08 and of group B was 1.29±0.21 respectively. The unpaired t- test value was 7.340(p<0.05). There was significant difference in the reduction of waist-hip ratio between the groups.


![]()
![]()
Comparison of Waist-Hip Ratio between the Group (Post Readings)
1.40
1.29
Mean SD
1.20
1.00
1.00
0.80
0.60
0.40
0.205
0.20
0.080
0.00
Group A
Group B
Waist-Hip ratio
Graph 4.12: Demonstrates the comparison of mean value and standard deviation of waist- hip ratio between Group A and Group B.
Table 4.13: Mean and SD of strength for the subjects of Group A and Group B (Pre Readings)
| Pre test | Group | Mean | S.D. | t- value | P value | Result |
| Strength (grade) | Group A | 3.60 | 0.932 | 0.540 | 0.5914 | Not-Significant |
| Group B | 3.73 | 0.980 |
Comparison of mean and standard deviation of strength between the pre readings of Group A and Group B. The mean of strength of group A was 3.60±0.93 and of group B was 3.73±0.98 respectively. The unpaired t- test value was 0.540(p>0.05). There was no significant difference in the strength between the groups.

Comparison of Strength between the Group (Pre Readings)
4.00
3.50
3.00
2.50
2.00
1.50
1.00
0.50
0.00
3.60
3.73
Mean SD
0.980
Group A Group B
Strength(grade)
0.932
Graph 4.13: Demonstrates the comparison of mean value and standard deviation of strength between Group A and Group B.
Table 4.14: Mean and SD of strength for the subjects of Group A and Group B (Post Readings)
| Post test | Group | Mean | S.D. | t- value | P value | Result |
| Strength (grade) | Group A | 4.90 | 0.662 | 0.350 | 0.7280 | Not-Significant |
| Group B | 4.97 | 0.809 |
Comparison of mean and standard deviation of strength between the post readings of Group A and Group B. The mean of strength of group A was 4.90±0.66 and of group B was 4.97±0.80 respectively. The unpaired t- test value was 0.350(p>0.05). There was no significant difference in the improvement of the strength between the groups.


![]()
![]()
Comparison of Strength between the Group (Post Readings)
6.00
MEAN SD
5.00
4.90
4.97
4.00
3.00
2.00
1.00
0.662
0.809
0.00
Group A
Group B
Strength(grade)
Graph 4.14: Demonstrates the comparison of mean value and standard deviation of strength between Group A and Group B.
Table 4.15: Mean and SD of endurance for the subjects of Group A and Group B (Pre Readings)
| Pre test | Group | Mean | S.D. | t- value | P value | Result |
| Endurance (per min) | Group A | 5.57 | 0.858 | 1.500 | 0.1397 | Not-Significant |
| Group B | 5.20 | 1.031 |
Comparison of mean and standard deviation of endurance between the pre readings of Group A and Group B. The mean of endurance of group A was 5.57±0.86 and of group B was 5.20±1.03 respectively. The unpaired t- test value was 1.500(p>0.05). There was no significant difference in the improvement of the endurance between the groups.

Comparison of Endurance between the Group (Pre Readings)
6.00
5.20
Mean SD
5.00
4.00
3.00
2.00
1.00
0.00
Group A
Group B
Endurance(per min)
5.57
0.858
1.031
Graph 4.15: Demonstrates the comparison of mean value and standard deviation of endurance between Group A and Group B.
Table 4.16: Mean and SD of endurance for the subjects of Group A and Group B (Post Readings)
| Post test | Group | Mean | S.D. | t- value | P value | Result |
| Endurance (per min) | Group A | 7.87 | 1.074 | 2.590 | 0.0121 | Significant |
| Group B | 7.10 | 1.213 |
Comparison of mean and standard deviation of endurance between the post readings of Group A and Group B. The mean of endurance of group A was 7.87±1.07 and of group B was 7.10±1.21 respectively. The unpaired t- test value was 2.59(p<0.05). There was significant difference in the improvement of the endurance between the groups.


![]()
![]()
Comparison of Endurance between the Group (Post Readings)
9.00
8.00
7.00
6.00
5.00
4.00
3.00
2.00
1.00
0.00
7.87
Mean SD
7.10
1.074
1.213
Group A Group B
Endurance(per min)
Graph 4.16: Demonstrates the comparison of mean value and standard deviation of endurance between Group A and Group B.
RESULTS
Total 68 subjects were taken but one subject was excluded as he did not met the inclusion criteria so, the total number of subjects were 67 with 33 subjects in Group A which received Theraband exercises for abdominal obesity and 34 subjects in Group B which received Pilates exercises for abdominal obesity (3 days per week for total 8 weeks). 3 subjects from Group A and 4 subjects from Group B left the treatment protocol in between because of inability to attend it regularly.
Comparison of mean and standard deviation of subject‟s age(20-40) between the group A(Theraband Exercises) and group B(Pilates Exercises).The mean age of group A was 34.40 ±
3.390 and that of group B was 33.00±3.484 respectively . The unpaired t-test value was 1.580(p>0.05). No significant difference was there in the age group.
The mean and standard deviation of the variable body fat percent within the group A was 34.37 ± 1.732 and 29.03 ± 2.220 respectively. Paired t-test was done within group A for the variable body fat percent to check the changes within the group. The t-value for body fat percent was 22.100(p<0.05).The result for the variable was significant which showed that there were significant changes within the group.
The mean and standard deviation of the variable waist circumference within the group A was
35.79 ± 1.674 and 33.15 ± 2.319 respectively. Paired t-test was done within group A for the variable waist circumference to check the changes within the group. The t-value for waist circumference was 9.940(p<0.05).The result for the variable was significant which showed that there were significant changes within the group.
The mean and standard deviation of the variable waist-hip ratio within the group A was 1.51 ±
0.237 and 1.00 ± 0.080 respectively. Paired t-test was done within group A for the variable waist-hip ratio to check the changes within the group. The t-value for waist-hip ratio was 12.050(p<0.05).The result for the variable was significant which showed that there were significant changes within the group.
The mean and standard deviation of the variable strength within the group A was 3.60 ± 0.93 and
4.90 ± 0.66 respectively. Paired t-test was done within group A for the variable strength to check
the changes within the group. The t-value for strength was 8.120(p<0.05).The result for the variable was significant which showed that there were significant changes within the group.
The mean and standard deviation of the variable endurance within the group A was 5.57 ± 0.858 and 7.87 ± 1.074 respectively. Paired t-test was done within group A for the variable endurance
to check the changes within the group. The t-value for endurance was 13.760(p<0.05).The result for the variable was significant which showed that there were significant changes within the group.
The mean and standard deviation of the variable body fat percent within the group B was 34.310
± 2.074 and 30.67 ± 2.040 respectively. Paired t-test was done within group B for the variable body fat percent to check the changes within the group. The t-value for body fat percent was 23.010(p<0.05).The result for the variable was significant which showed that there were significant changes within the group.
The mean and standard deviation of the variable waist circumference within the group B was
35.79 ± 1.973 and 34.48 ± 1.953 respectively. Paired t-test was done within group B for the variable waist circumference to check the changes within the group. The t-value for waist circumference was 8.750(p<0.05).The result for the variable was significant which showed that there were significant changes within the group.
The mean and standard deviation of the variable waist-hip ratio within the group B was 1.56 ±
0.219 and 1.29 ± 0.205 respectively. Paired t-test was done within group B for the variable waist- hip ratio to check the changes within the group. The t-value for waist-hip ratio was 6.670(p<0.05).The result for the variable was significant which showed that there were significant changes within the group.
The mean and standard deviation of the variable strength within the group B was 3.73 ± 0.98 and
4.97 ± 0.81 respectively. Paired t-test was done within group B for the variable strength to check the changes within the group. The t-value for strength was 9.950(p<0.05).The result for the variable was significant which showed that there were significant changes within the group.
The mean and standard deviation of the variable endurance within the group B was 5.20 ± 1.031 and 7.10 ± 1.213 respectively. Paired t-test was done within group B for the variable endurance
to check the changes within the group. The t-value for endurance was 9.250(p<0.05).The result for the variable was significant which showed that there were significant changes within the group.
Unpaired t-test was done for the pre-readings of body fat percent between the group A and B to check the changes between the groups. The t-value for body fat percent was 0.540(p>0.05). The result for the variable was not significant.
Unpaired t-test was done for the pre-readings of waist circumference between the group A and B to check the changes between the groups. The t-value for waist circumference was 0.010(p>0.05). The result for the variable was not significant.
Unpaired t-test was done for the pre-readings of waist-hip ratio between the group A and B to check the changes between the groups. The t-value for waist-hip ratio was 0.900(p>0.05). The result for the variable was not significant.
Unpaired t-test was done for the pre-readings of strength between the group A and B to check the changes between the groups. The t-value for strength was 0.540(p>0.05). The result for the variable was not significant.
Unpaired t-test was done for the pre-readings of endurance between the group A and B to check the changes between the groups. The t-value for endurance was 1.500(p>0.05). The result for the variable was not significant.
Unpaired t-test was done for the post-readings of body fat percent between the group A and B to check the changes between the groups. The t-value for body fat percent was 2.970(p<0.05). The result for the variable was significant which showed that there were significant changes between the groups.
Unpaired t-test was done for the post-readings of waist circumference between the group A and B to check the changes between the groups. The t-value for waist circumference was 2.400(p<0.05). The result for the variable was significant which showed that there were significant changes between the groups.
Unpaired t-test was done for the post-readings of waist-hip ratio between the group A and B to check the changes between the groups. The t-value for waist-hip ratio was 7.340(p<0.05). The result for the variable was significant which showed that there were significant changes between the groups.
Unpaired t-test was done for the post-readings of strength between the group A and B to check the changes between the groups. The t-value for strength was 0.350(p>0.05). The result for the variable was not significant.
Unpaired t-test was done for the post-readings of endurance between the group A and B to check the changes between the groups. The t-value for endurance was 2.590(p<0.05). The result for the variable was significant which showed that there were significant changes between the groups.
DISCUSSION
The study was designed to evaluate the comparative effect of Theraband exercises and Pilates exercises in abdominal obesity. 60 subjects were taken and divided into 2 groups, 30 patients in each group. Group A received Theraband exercises for abdominal obesity (3 days per week) and Group B received Pilates exercises for abdominal obesity (3 days per week), for total 8 weeks.
The selected parameters were Body Fat Percent, Waist Circumference, Waist-Hip Ratio, Strength and Endurance. Data was collected at baseline (day 0) and after 8 weeks of treatment to evaluate the changes in the mentioned parameters.
The findings of the present study show that there is a significant difference in the reduction of body fat percent, waist circumference, waist-hip ratio and improvement in the strength and endurance of abdominal muscles within the groups. Significant difference was found between the groups on the 8th week of protocol in all the parameters except for the improvement in the strength of abdominal muscles. But there was appreciably more significant difference in the group with the treatment protocol of theraband exercises than the group with pilates exercises.
Abdominal obesity occurs when there is excessive deposition of fat around the abdomen which causes negative impact over the health(2). Abdominal obesity is usually measured in terms of waist circumference(3,4). It has been found that the abdominal obesity is one of the leading cause of cardiovascular diseases along with metabolic diseases(5, 14).
Abdominal muscles are considered as operational stability system for the spine which protect it from several injuries and hence the weakness of these muscles can result into the decreased spinal stability(44). There are abdominal exercises which build up the abdominal muscles in order to improve their performance and along with this they also increase the strength and endurance of the abdominal muscles(20).
Theraband exercises reduces the total fat mass and glycosylated hemoglobin, decreases the abdominal fat and insulin resistance by increasing the muscle mass and also improves the blood lipid profiles in abdominal obesity. When compared with theraband exercises, aerobic exercises reduces visceral fat and decreases insulin resistance but there is no effect on the mass of a abdominal muscles and hence the muscle strength reduces at a greater rate(56).
Dynamic resistance training program with the use of free weights put more stress over the skeletal muscle and can cause injuries. Theraband training control the strength as per the person‟s physical condition and provides proper individualized load by increasing the band resistance gradually as there is increase in the muscle strength(56).
Theraband provides resistance based on the amount that the band is stretched. This resistance can be calculated in pounds of force which depends on the percentage the band is stretched from its resting length which is known as „Force Elongation‟. Therabands provide a strength curve (torque) similar to human strength curve and isotonic resistance exercises (bell shaped curve) which occurs because of the angle created between the band and the lever arm and the angle is known as „Force Angle‟(69).
Theraband does not rely on gravity and provides continuous tension to the muscles which are being trained. It provides linear variable resistance which means as we increase range of motion of the exercise, the resistance offered by the band is also increased. Therefore, there is more increase in the muscle strength as more muscle fibres are used during the training(69).
There are many forms of dance, movement education along with several rehabilitation methods which are influenced by the Pilates method. It has also become a part of the exercise prescription in many of the bodywork fields(70).
Pilates is a fitness program of mind and body that incorporates breathing and movement to achieve balance and body awareness(50). Pilates exercises can be performed in group or private settings with and without apparatus. Pilates exercises focus upon the core musculature eg. Abdominal muscles, back, hips and shoulder girdle. The movements rely upon correct positioning of the body relative to the gravity as well as limb length alterations to develop the core muscles(49).
A few research had mentioned that the physical activity has been commonly used and studied as a health related factor and it is also mentioned that there is significant influence of regular physical activity on health. Moreover, Pilates is popular amongst women and it has also given a new way to physiotherapy(71).
Pilates exercises increases the insulin sensitivity through the reduction of body fat percentage and fat deposition in the waist region which results in decreased leptin levels through regulation of insulin and in turn fat is distributed(72).
Triber FA et al.(1998) conducted a study to determine the effect of a 4 week isotonic resistance training program with the help of theraband on concentric shoulder rotator strength in tennis players and found that internal rotation torque at both slow and fast speeds and also in external rotation torque at fast speed is improved. Hence concluded that resistance training have beneficial effects on strength and functional performance, the result of the present study was supported by the results of Triber FA in increased strength of core muscles by use of therabands(69) . The same findings were also concluded by Varun Naik in a non-published thesis on athletes with low back pain which showed the improvement in core strength with therabands(69).
Baldi and Snowling did a study and found that even though 10 weeks of resistance training decreased the insulin level, insulin resistance was not changed. This concluded that the effectiveness of resistance training on improving insulin resistance vary according to the frequency, intensity and duration of training(56).
Therefore low intensity exercise should be done during the early stages of resistance training daily and then doing them for 3 days a week(56). The results from these studies support our study for the improvement of strength of abdominal muscles.
Another study did a research to find the effect of 12 week pilates exercise program for overweight women and they found that skin fold thickness and BMI was reduced . This result showed that the pilates exercise program had potential to improve performance in many physiological variables for overweight women. Ramezankhany et al. (2010) compared low calorie diet, aerobic and pilates exercises in sedentary women and found the significant changes in waist-hip ratio and weight loss(49).
Ferreira et al. (2009) checked the effect of pilates exercises on body composition for sedentary women and no statistically significant difference was found among the exercise group and control group at baseline. It was thought that the frequency and intensity may be the cause as the subjects participated in pilates program for only 2 hours in each weak(49).
Barbara Strasser et al. studied about the evidence of resistance training in the treatment of obesity and concluded that resistive exercises mobilizes the visceral and subcutaneous adipose tissue in the abdominal region. It is also reported that when resistive exercises are performed with sufficient intensity and regularly, it stimulates the skeletal muscle to synthesize new muscle proteins(55). This study is in the support of our study which showed that theraband exercises are beneficial in the reduction of body fat percent, waist circumference and waist-hip ratio in abdominal obesity.
A recent study did examination about the effects of systematic resistance training in aged people and found that the training having 2 sessions per week was as proficient as the training involving 3 sessions per week but the number of sets should be equally done(55).
However, these findings contradict the results of earlier study which had concluded that 3 sessions of training per week has more strength gain when compared to the resistance training given for 2 sessions a week(55) and it also supports our present study as the treatment protocol for the reduction of abdominal obesity taken in the study was 3 sessions per week for 8 weeks.
The previous studies showed that the resistance training helps to reduce the glycosylated hemoglobin levels in people with abnormal glucose metabolism and consequently improves the lipoprotein lipid profiles. In people with metabolic risks, decreased fat mass, improved blood lipid profiles and glycemic control are essential to decrease micro and macro vascular complications(55).
Based on the findings of all these studies, the resistance training is well thought-out to be a potential addition in the treatment of metabolic disorders by decreasing the risk factors for metabolic syndromes. The study also concluded that the resistance training can be used or suggested in managing the obesity and metabolic disorders (52). The results from these studies further support our present study that theraband exercises are more effective and beneficial in reducing the body fat percent, waist circumference, waist-hip ratio and improving the endurance and strength of abdominal muscles.
Muscle endurance can be defined as the ability of a muscle to produce and maintain force production for prolonged periods of time. Research has shown that resistance training protocols improves the muscular endurance with high repetition. Campos et al. found that higher
repetitions (2 sets of 20-28 repetitions with 1 minute rest period starting with 2 days/week) increased muscle endurance. Marx et al. found that after the initial 12 weeks of training results in a threefold decrease in body fat and an increase in muscle endurance with significant increase in lean body mass (73). This supports the present study as muscle endurance is significantly improved with the theraband exercises protocol.
Resistance training affects the amount of fat mass as a result of the direct effect of the training on energy consumption. Lower volume training burns less calories as compared to the higher volume training. Also the resistance training increases the energy consumption during the recovery period between training sessions further causing the fat loss (74).
In the study, the theraband exercises come out with more effectiveness than the Pilates exercises because the resistance provided by the theraband is based on the amount of stretching of band. The beginning of the exercise is done with the color band providing the appropriate resistance according to the strength of a person and is increased gradually as the strength increases of abdominal muscles whereas Pilates exercises are based on certain principles which had to be followed effectively while performing exercises like breathing, concentration etc. in order to gain more efficiency.
LIMITATIONS
- Convenient sampling was used.
- Absence of control group.
- Subjects were not asked for any sort of diet control.
- Follow up was not taken to check retention effect of the treatment.
Recoomendation
- Gender specific studies can be done to see the effect of intervention protocol.
- Studies to check the effect of diet control along with exercises on reduction of abdominal obesity can be done as a future scope.
- A long term follow-up of the study is recommended for a more comprehensive analysis of recovery.
- The strength of abdominal muscles can also be investigated through electromyographyic finding
CONCLUSION
The present study concluded that there is a significant difference in the reduction of body fat percent, waist circumference, waist-hip ratio and improvement in the endurance of the abdominal muscles but no significant difference has been seen in the improvement of abdominal muscle strength between the Group A and Group
REFERENCES
- Iscoe S. Control of abdominal muscles, Progress in Neurobiology, 1998, Vol. 56 (4), page no. 433–506.
- Yusuf S, Hawken S, Ounpuu S, Dans T, Avezum A, Lanas F, McQueen M, Budaj A, Pais P, Varigos J, Lisheng L, Effect of potentially modifiable risk factors associated with myocardial infarction in 52 countries, 2004, Lancet 364 (9438), page no. 937–52.
- Deepa M, Farooq S, Deepa R, Manjula D, Mohan V. Prevalence and significance of generalized and central body obesity in an urban Asian Indian population in Chennai, India Eur J Clin Nutr. 2009, Vol. 63(2), page no. 259-267.
- Misra A, Pandey RM, Devi JR, Sharma R, Vikram NK, Khanna N. High prevalence of diabetes, obesity and dyslipidaemia in urban slum population in northern India. International Journal Obesity Related Metabolic Disorders, 2001, Vol. 25(11), page no. 1722-1729.
- Carey D.G.P. Abdominal obesity.current opinion in lipidology, 1998, Vol. 9(1), page no.35- 40.
- Yusuf S, Hawken S, Ounpuu S, Dans T, Avezum A, Lanas F, McQueen M, Budaj A, Pais P, Varigos J, Lisheng L, Effect of potentially modifiable risk factors associated with myocardial infarction in 52 countries, 2004, Lancet 364 (9438), page no. 937–52.
- Razay, George, Abdominal obesity and alzheimer’s disease, dementia & genetic cognitive disorders, July 2006.
- American Journal of Hypertension, 10-year study of Chinese adults published in the August 2006.
- Poehlman, Eric T. Abdominal obesity: the metabolic multi-risk factor, 1998, Vol.9 (8), page no. 469–471.
- Dalia M. Kamel et al. Effect of abdominal versus pelvic floor muscle exercises in obese Egyptian women with mild stress urinary incontinence, Hong Kong Physiotherapy Journal 2013, Vol.31, page no. 12-18.
- http://www.nfhsindia.org/nfhs3.html. Accessed on 6 March, 2012
- Gupta R, Gupta VP. Obesity is major determinant of coronary risk factors in India, Indian Heart Journal, 2008, Vol.60, page no. 26-33.
13).Ramachandran A, Snehalatha C. Rising burden of obesity in Asia, Journal of Obesity, 2010
- Gupta S, Kapoor S. Sex differences in blood pressure levels and its association with obesity indices: Who is at greater risk, Ethn Dis, 2010, Vol.20, page no.370-5.
- Garg C, Khan SA. Prevalence of obesity in Indian women, Obes Rev, 2010, Vol.11, page no.105-8.
- Yajnik CS, Ganpule-Rao, The obesity-diabetes association: What is different in Indians? International Journal Low Extremity Wounds, 2010, Vol.9, page no. 113-5.
- Pandya H, Lakhani JD, Patel N, Obesity is becoming synonym for diabetes in rural areas of India also-an alarming, International Journal Biol Med Research, 2011, Vol.2, page no.556-60.
- Freidman and Eisen 2005, page no.16
- T Murphy, Lyles, Demons, Lenchik, Nicklas, Addition of aerobic exercise to dietary weight loss preferentially reduces abdominal adipocyte size, International Journal of Obesity,2006, Vol. 30 (8), page no. 1211–6.
- J Korean Academy Community Health Nursing, 2011, Vol.22(4), page no. 451-457.
- Jorge Perez-Gomez, Germán Vicente-Rodríguez, Ignacio Ara Royo, Diana Martínez- Redondo, José Puzo Foncillas, Luis A. Moreno, Carmen, Díez-Sánchez and José A. Casajús1, Effect of endurance and resistance training on regional fat mass and lipid profile, Nutr Hosp, 2013, Vol.28(2), page no.340-346.
- Kim JH, Noh JC, Kang SJ, Effects of aerobic and resistance exercise on insulin resistance, C-reactive protein, physical fitness in middle-aged women with metabolic syndrome, Health & Sports Medicine, 2013, Vol.15(2), page no.81-91.
- Ibanez J, Izquierdo M, Arguelles I, Forga L, Larrion JL, Garcia- Unciti M, Idoate F, Gorostiaga EM. Twice-weekly progressive resistance training decreases abdominal fat and improves in- sulin sensitivity in older men with type 2 diabetes, Diabetes Care, 2005, Vol.28, page no.6627.
- Ross R, Dagnone D, Jones PJ, et al. Reduction in obesity and related comorbid conditions after diet-induced weight loss or exercise-induced weight loss in men, Ann Intern Med, 2000,Vol.133, page no.92–103.
- Lee S, Kuk JL, Davidson LE, et al. Exercise without weight loss is an effective strategy for obesity reduction in obese individuals with and without type 2 diabetes, J Appl Physiol, 2005, Vol.99, page no.1220–5.
- Giannopoulou I, Ploutz-Snyder LL, Carhart R, et al. Exercise is required for visceral fat loss in postmenopausal women with type 2 diabetes, J Clin Endocrinol Metab, 2005, Vol.90, page no.1511–18.
- Mourier A, Gautier J-F, Kerviler ED, et al. Mobilization of visceral adipose tissue related to the improvement in insulin sensitivity in response to physical training in NIDDM: effects of branched-chain amino acid supplements, Diabetes Care, 1997, Vol.20, page no.385–91.
- Sigal RJ, Kenny GP, Boule NG, et al. Effects of aerobic training, resistance training or both on glycemic control in type 2 diabetes, Ann Intern Med 2007,Vol.147, page no.357–69.
- Ryan AS, Hurlbut DE, Lott ME, Ivey FM, Fleg J, Hurley BF, Goldberg AP. Insulin action after resistive training in insulin resistant older men and women, J Am Geriatr Soc 2001, Vol.49, page no.247-53.
- Misra A, Alappan NK, Vikram NK, Goel K, Gupta N, Mittal K, Bhatt S, Luthra K. Effect of supervised progressive resistance- exercise training protocol on insulin sensitivity, glycemia, lip- ids, and body composition in Asian Indians with type 2 diabe- tes. Diabetes Care 2008, Vol. 31, page no.1282-7.
- Sigal RJ, Kenny GP, Boule NG, Wells GA, Prud‟homme D, For- tier M, Reid RD, Tulloch H, Coyle D, Phillips P, Jennings A, Jaffey J. Effects of aerobic training, resistance training, or both on glycemic control in type 2 diabetes, Ann Intern Med 2007, Vol.147, page no.357-69.
- Patterson RM, Stegink Jansen CW, Hogan HA, Nassif MD. Material properties of Thera- Band Tubing, Phys Ther 2001, Vol.81, page no.1437-45.
- Hughes CJ, Hurd K, Jones A, Sprigle S. Resistance properties of Thera-Band tubing during shoulder abduction exercise, J Orthop Sports Phys Ther 1999, Vol.29, page no.413-20.
- Salvi Shah, Pilates Exercises, International Journal of Physiotherapy and Research, 2013, Vol. 1 (4), page no.196-203
- Carolyn Kisner and Lynn Allen Colby, Therapeutic Exercises 5th Edition, Chapter-6 , Page No. 149
- The Pilates method book, retrieved 2 February 2011
- Friedman and Eisen, 2005, page no. 13
- Suzanne Farrell, cited in Freidman and Eisman, 2005, page no. 15
- Friedman and Eisen, 2005, page no. 15
- Romana Kryzanowska cited in Freidman and Eisen, 2005, page no. 16
- Return to Life through Contrology, Bodily house-cleaning through circulation, page no. 14
- Romana Kryzanowska cited in Friedman and Eisen, 2005, page no. 17
- Wiliams and Wikins et al. ACSM‟s health related physical fitness assessment manaual, 2nd edition, chapter 4, page no. 64-65
- Alexandre Wesley Carvalho Barbosa et al. The Pilates breathing technique increases the electromyographic amplitude level of the deep abdominal muscles in untrained people, Journal of Bodywork & Movement Therapies, 2015, Vol. 19, page no.57-61.
- Jamil Natour et al. Pilates improves pain, function and quality of life in patients with chronic low back pain, Clinical Rehabilitation 2015, Vol. 29(1), page no.59 –68.
- Devon A Dobrosielski et al. Effect of exercise on abdominal fat loss in men and women with and without type 2 diabetes, BMJ Open 2013, Vol.3, page no.3897.
- M Fourie et al. Effects of a Mat Pilates Programme on Body Composition in Elderly Women West Indian Med J 2013, Vol.62(6), page no.524.
- Dalia M. Kamel et al. Effect of abdominal versus pelvic floor muscle exercises in obese Egyptian women with mild stress urinary incontinence, Hong Kong physiotherapy journal 2013, Vol.31, page no.12-18.
- Evrim Cakmaker Effects of 10 weeks pilates mat exercises program on weight loss and body composition for overweight Turkish women, World Applied Sciences Journal 2012, Vol.19(3), page no.431-438.
- Mr. S. Venugopal et al. Effects of Pilates Training and Yogic Training with and without Combination on Selected Physical Fitness Components among College Level Obese Students, Indian Journal Of Research 2012, Volume : 1 Issue : 9, page no. 2250-1991.
- Pardis Noormohammadpour et al. The effect of abdominal resistance training and energy restricted diet on lateral abdominal muscles thickness of overweight and obese women, Journal of body work and movement therapies 2012, Vol. 16 Issue 3, page no. 344-35.
- SoJung Lee et al. Effects of aerobic versus resistance exercise without caloric restriction on abdominal fat, intrahepatic lipid, and insulin sensitivity in obese adolescent boys, Diabetes 2012, Vol.61, page no.2787-2795.
- Ian A.F. Stokes et al. Abdominal muscle activation increases lumbar spinal stability , NIH Public Access , Clin Biomech (Bristol, Avon) 2011, Vol. 26(8), page no.797–803.
- Duncan J. Critchley et al. Effect of pilates mat exercises and conventional exercise programmes on transversus abdominis and obliquus internus abdominis activity, Manual therapy 2011, Volume 16, Issue 2, Page no. 183–189.
- Barbara Strasser, Uwe Siebert and Wolfgang Schobersberger et al. Resistance Training in the Treatment of the Metabolic Syndrome 2010, Vol. 40 (5), page no.397-415.
- Hwi Ryun Kwon et al. The Effects of resistance training on muscle and body fat mass and muscle strength in type 2 diabetic women, Korean Diabetes Journal 2010, Vol.34, page no.101- 110.
- Cris A. Slentz Joseph A. Houmard and William E. Kraus et al. Exercise, abdominal obesity, skeletal muscle, and metabolic Risk: evidence for a dose response, Obesity Silver Spring 2009, Vol.17(03), page no.S27–S33.
- Suoma E. Saarni et al. Association of Smoking in Adolescence With Abdominal Obesity in Adulthood, American Journal of Public Health, 2009, Vol 99, Issue No.2.
- Y Ye et al. Identification of waist circumference cutoffs for abdominal obesity in Chinese population, International Journal of Obesity 2009, Vol.33, page no.1058-1062.
- Crystal Man Ying Lee et al. Indices of abdominal obesity are better discriminators of cardiovascular risk factors than BMI, Journal of Clinical Epidemiology 2008, page no.646-653.
- Betu l Sekendiza et al. Effects of Pilates exercise on trunk strength, endurance and flexibility in sedentary adult females, Journal of Bodywork and Movement Therapies 2007, Vol. 11, page no.318–326.
- Betul Sekendiz et al. Effects of pilates exercises on trunk strength, endurance and flexibility in sedentary adult females, Journal of Bodywork and Movement Therapies 2007, Vol. 11, page no.318-326.
- Bryan J. Taylor et al. Exercise-induced abdominal muscle fatigue in healthy humans, J Applied Physiology 2006, Vol. 100, page no.1554 –1562.
- Aviva Must, Jennifer Spadano, Eugenie H. Coakley, Alison E. Field, Graham Colditz, William H. Dietz et.al The disease burden associated with overweight and obesity.
