


")
")
")


Issue – II
ISSUE- II (2020)
INDEX
SR. NO. | CONTENT | NAME | PAGE NO. |
1 | “EFFECTIVENESS OF MIRROR THERAPY WITH CONVENTIONAL THERAPY VERSUS CONVENTIONAL THERAPY ALONE TO IMPROVE FUNCTIONAL ACTIVITY OF UPPER EXTREMITY IN CHRONIC STROKE PATIENTS: A COMPARATIVE STUDY” | Neelam Nimawat | |
2 | “A COMPARATIVE STUDY ON THE EFFECTIVENESS OF SPECIFIC BALANCE STRATEGY VERSUS CONVENTIONAL BALANCE TRAINING TO IMPROVE BALANCE IN MULTIPLE SCLEROSIS PATIENTS – A RANDOMIZED CONTROLLED TRIAL.” | Dr. Arushi Tandon, B.P.T, Dr. Pragya Bhatt, M.Sc Anatomy (Medical) | |
3 | Factors influencing the implementation of Evidence-Based Practice among Indonesian Physiotherapists in Jakarta and the surrounding area, Indonesia | 1. Septian Arief Gandaputra, Imam Waluyo, Ho-Jui Tung, Ferry Efendi, Hery Prambudi | |
4 | A COMPARATIVE STUDY BETWEEN MANUAL THERAPY AND CONVENTIONAL THERAPY IN CASE OF PLANTAR FASCIITIS | Mukesh Kumar Goyal | |
5 | BIOMECHANICS IN PATELLOFEMORAL PAIN SYNDROME | Dr Muskan Rathor | |
6 | IMPACT OF NEURAL MOBILIZATION IN SCIATICA | Dr Sheenam Popli | |
7 | Comparison between the effects of core exercises with Mckenzie method versus core exercises with Myofascial release Technique in stage – 2 of lumbar disc prolapse | Dr. Manash Kanti Chakraborty | |
8 | A COMPARATIVE STUDY ON EFFECTIVENESS OF MOTOR IMAGINARY TECHNIQUE ON IMPROVING UPPER LIMB FUNCTION IN MIDDLE CEREBRAL ARTERY STROKE | Dr. Navjyoty, MPT Neuro, Dr. Divya Tiwari, MPT Cardio | |
9 | ACUTE TRAUMATIC INJURY IN COMPETITIVE CYCLING IN INDIA (ROAD AND TRACK CYCLING) | Himanshu1 and Sinha A.G.K.2 | |
10 | “TO COMPARE THE EFFECTIVENESS OF MUSCLE ENERGY TECNIQUE AND SOFT TISSUE MASSAGE TECHNIQUE FOR IMPROVMENT OF PAIN AND FUNCTIONAL DISABILITY ON MECHANICAL LOW BACK PAIN PATIENTS” | Dr. Pragya Bhatt, M.Sc. Anatomy (Medical), Dr. Arushi Tandon, B.P.T., | |
11 | COMPARING THE EFFECTS OF SURYANAMASKAR VERSUS CORE STABILIZATION USING PILATES BALL ON WEIGHT REDUCTION AMONG COLLEGIATE PLAYERS. | Dr. Vinod Nair, | |
12 | EFFECTIVENESS OF THERABAND EXERCISES VERSUS PILATES EXERCISES ALONG WITH BASIC ABDOMINAL EXERCISES IN REDUCTION OF ABDOMINAL BELLY | Dr. Divya Tiwari, M.P.T Cardio | |
13 | TO COMPARE THE EFFECT OF MAT EXERCISE AND GYM BALL EXERCISES REGIMENS ON TRUNK CONTROL AND FUNCTIONAL BALANCE IN PATIENTS WITH CHRONIC STROKE | Pritesh Prajapat Shailendra Mehta | |
14 | Systemic Sclerosis — A polysegmental Reflex Dystrophy Treated by Matrix Rhythm Therapy. Case Report Seven Years After Diagnosis | U.G. Randoll 1; Y. Largiadèr 2 | |
15 |
ARTICLES FOR JOURNAL
“EFFECTIVENESS OF MIRROR THERAPY WITH CONVENTIONAL THERAPY VERSUS CONVENTIONAL THERAPY ALONE TO IMPROVE FUNCTIONAL ACTIVITY OF UPPER EXTREMITY IN CHRONIC STROKE PATIENTS: A COMPARATIVE STUDY”
Neelam Nimawat
ABSTRACT
BACKGROUND: Stroke is one of the major cause of death and disability in adults worldwide. A stroke is defined by the World Health Organization (WHO) as a syndrome of ―rapidly developing clinical symptoms and/or signs of focal (or at times global) disturbance of cerebral function lasting more than 24 hours (unless interrupted by surgery or death), with no apparent cause other than vascular origin.‖ The majority are ischemic, secondary to arterial occlusion by in-situ thrombus or embolus. Stroke affects postural and functional movements, paresis is present in hemibody or one side of upper and lower limbs. More than 80% of survivors have paresis of upper limb and 30 to 60% of these patients cannot use the paretic upper limb which compromises their independent and quality life. Mirror therapy is a simple non-invasive technique for the treatment of hemiparesis after stroke. Visual feedback is supposed to be used to match and recalibrate proprioceptive sensory informations or input that may be impaired to stroke. The present investigation was planned to find out the effectiveness of mirror therapy with conventional therapy versus conventional therapy alone on upper limb activities in chronic stroke patients
AIMS AND OBJECTIVES: To study the effectiveness of mirror therapy with conventional therapy versus conventional therapy alone on upper limb activities in chronic stroke patients.
METHODOLOGY: Thirty chronic stroke patients with upper limb involvement were randomly selected according to inclusion and exclusion criteria and were divided into two groups – Group A and Group B. Both the groups were assessed for the upper limb functional status using fugl meyer assessment – upper extremity and upper limb motor assessment using Motor assessment scale – upper limb. These parameters were assessed before the start of the program as pre-test values and at the end of 12 week as post-test values. Group A received mirror therapy with conventional therapy and Group B conventional therapy alone.
RESULT: The mean age of group A was 59.20 years and group B was 59.80 years. The statistical analysis correlates the study by proposing that groups taken for study 2 either group A and B showed significant effect in improvement in upper limb functions of chronic stroke patients. The group A had higher significance when compared to group B. The mean improvement in upper limb function scores of FMA-UE was 29.20 and 16.53 in group A and B, respectively. The mean improvement in motor assessment measured by MAS-UL was 14.73 and 10.07 in group A and B, respectively. It was resulted that mirror therapy with conventional therapy had a superior effect over conventional therapy alone.
CONCLUSION: This study concluded that mirror therapy with conventional therapy had effective technique in improving upper limb functions in chronic stroke patients.
KEY WORDS: Stroke, upper limb function, Mirror therapy, Conventional therapy
INTRODUCTION
Stroke is one of the major causes of death and disability in adults worldwide. The majority of survivors show some degree of recovery but more than 50% still present with some sensory and motor deficits and only 30% of these patients can return to work during the first year post-stroke. Stroke affects postural and functional movement, paresis is present in hemibody or one side of upper and lower limbs. More than 80% of survivors have paresis of upper limb and 30 to 60% of these patients cannot use the paretic upper limb which compromises their independent and quality life.
Stroke is defined by the World Health Organization (WHO) as a syndrome of ―rapidly developing clinical symptoms and/or signs of focal (or at times global) disturbance of cerebral function lasting more than 24 hours (unless interrupted by surgery or death), with no apparent cause other than vascular origin.‖ The majority are ischemic, secondary to arterial occlusion by in-situ thrombus or embolus.
A stroke is the disturbance in blood supply, when blood vessel ruptured or blocked by a clot, which cuts off the oxygen supply and nutrients to the brain, causing damage to the brain tissue. Stroke is a clinical syndrome divided into two broad classifications such as ischemic stroke which is caused by sudden occlusion of arteries supplying the brain, either due to a thrombus at the site of occlusion or formed in another part of the circulation. It accounts for 50% to 85% of all strokes worldwide. A haemorrhagic stroke occurs due to injury to a blood vessel wall and formation of clot. It accounts for 15% of all strokes worldwide.
Stroke is due to upper motor neuron lesion and is characterized by the motor paralysis or paresis, perceptual problems, altered balance, cranial nerve problems, reflex sympathetic dystrophy, shoulder subluxation, gait problems and spasticity.
Stroke was the second most frequent cause of death after heart diseases, accounting for 6.4 million deaths, in which ischemic stroke resulted in 3.3 million deaths and hemorrhagic stroke resulted in 3.2 million deaths. Almost half of the 4 stroke patients live less than one year and two thirds of strokes occurred in those over 65 years old. Worldwide stroke is the fourth leading cause of disability. According to the World Health Organization, each year 15 million people worldwide suffer from stroke. In that nearly 5 million people die and another 5 million people are left permanently disabled. It forecasts that disability-adjusted life years lost to stroke, will rise from 38 million in 1990 to 61 million in 2020. The prevalence of new or recurrent stroke is nearly 750,000 in each year and above 4 million is living with the residual effects of stroke which includes paralysis and disability
In India, stroke is one of the leading causes of death and disability. The prevalence rate ranges from 84-262/100,000 in rural areas and 334-424/100,000 in urban areas. Stroke signified 1.2% of total deaths in India
Traditional rehabilitation programs for improving functional use of the arm, commonly used are compensatory strategies, splinting, task riented practice strategies, constraint induced movement therapy, electro-myography (EMG) biofeedback, acupuncture, strengthening exercises and various approaches like neuro-developmental therapy (NDT), proprioceptive neuro-muscular facilitation (PNF), Rood‘s approach, Brunnstrom approach, Vojta approach. There are now multiple approaches, many relating to brain plasticity, including: (a) Use of a body part enhances its function, for example, by constraint-induced movement therapy, neuromuscular electrical stimulation (NMES), Robot aided movement therapy and virtual reality. (b) The ipsilateral hemisphere can contribute to motor control; bilateral, symmetrical arm movement training may help on this basis. (c) Sensory stimulation enhances plasticity. It can be given through transcutaneous electrical stimulation or acupuncture. (d) Reduction of inhibition enhances plasticity. This has been demonstrated to be useful for rehabilitation utilizing transient deafferentation. (e) Many pharmacological agents can induce plasticity.
Mirror therapy is a simple non-invasive technique for the treatment of hemiparesis after stroke. Visual feedback is supposed to be used to match and recalibrate proprioceptive sensory informations or input that may be impaired to stroke.
Mirror therapy is relatively new therapeutic intervention for stroke patients. It is a simple, inexpensive and, most importantly, patient directed treatment that may improve upper-extremity function. It involves performing movements of unimpaired limb while watching its mirror reflection superimposed over the (unseen) impaired limb (motor imagery). It creates a visual illusion of enhanced movement capability of the impaired limb.
Many researchers used conventional therapy, mirror therapy and constraint induced movement therapy program to recover upper extremity function. Mirror therapy is an evidence based program in an enriched environment to increase the use of the affected upper extremity. Many results recommended that Mirror therapy may be a successful method of improving function and use of the affected arms of patients exhibiting learned non-use. However, many studies were done on stroke for improving the upper extremity functions but there is lack of evidence of studies on Mirror therapy, hence keeping the above facts in view, the present investigation was planned to find out the effect of Mirror therapy on upper extremity functions in chronic stroke patients.
NEED OF THE STUDY
There is a need to incorporate simple, easy, economic, patient directed and effective treatment techniques to enhance recovery following stroke. Current rehabilitation techniques focus on physical therapy, using guided limb range of motion exercises, manipulation, stretching exercises, strengthening exercises, cryotherapy and taskoriented training. These exercises combine passive and active movement in an attempt to rebuild neuronal connections damaged by the stroke. Adding mirror therapy to traditional therapy enlists visual stimulation showing improvement in motor function.
Previous research has shown that mirror therapy can improve the motor function of acute and sub-acute stroke patients with mild to moderate impairment. Moreover, interventions involving stroke survivors with upper limb paresis have been shown to provide limited motor improvement in the acute or sub-acute phase. But no evidence has found to compare the effectiveness of mirror therapy with conventional therapy and conventional therapy alone to improve functional activity of upper extremity in chronic stroke patients. Therefore, present study was conducted to evaluate the comparative effectiveness of mirror therapy with conventional therapy and conventional therapy alone to improve functional activities of upper extremity in chronic stroke patients.
AIMS AND OBJECTIVES OF THE STUDY AIM OF THE STUDY:
The aim of the study to compare the effectiveness of mirror therapy with conventional therapy versus conventional therapy alone to improve functional activities of upper extremity in chronic stroke patients.
OBJECTIVES OF THE STUDY:
The main objectives of the study are:
1. To study the effectiveness of mirror therapy with conventional therapy to improve functional activities of upper extremity in chronic stroke patients.
2. To study the effect of conventional therapy to improve functional activities of upper extremity in chronic stroke patients.
3. To compare the effect of mirror therapy with conventional therapy and conventional therapy alone to improve functional activities of upper extremity in chronic stroke patients
HYPOTHESIS
ALTERNATIVE HYPOTHESIS
It states that there is significant difference between mirror therapy with conventional therapy and conventional therapy alone to improve functional activities of upper extremity in chronic stroke patients.
NULL HYPOTHESIS
It states that there is no significant difference between mirror therapy with conventional therapy and conventional therapy alone to improve functional activities of upper extremity in chronic stroke patients.
METHODOLOGY
1. STUDY DESIGN: Comparative study.
2. SAMPLE SIZE: 30 chronic stroke patients with of upper limb functional involvement.
3. SAMPLING DESIGN: Randomized. 4. STUDY CENTRE: OPDs of JRNRV college of Physiotherapy, Udaipur, Rajasthan.
5. DURATION OF THE STUDY:
- 12 weeks.
- Six days per week
- One hours per day
6. SELECTION CRITERIA
i. INCLUSION CRITERIA:
Patients with chronic stroke duration between 6 months to 2 years.
Age group: 40-75years.
Both genders.
Patients with right or left upper extremity hemiparesis.
Patients who have 10 degree active wrist extension, 10 degree active thumb abduction and 10 degree active extension of any two digits of affected hand.
ii. EXCLUSION CRITERIA:
Post stroke hemiparesis patients with cognitive disturbances.
Chronic spastic hemiplegic patients.
Age above 75 years and below 40 years.
Hemiplegia or hemiparesis due to head injury.
Any musculoskeletal condition of upper limb.
Psychosomatic patients.
Visual and hearing problem
patient with cardiopulmonary condition
PROCEDURE
Thirty chronic stroke patients was randomly selected according to inclusion and exclusion criteria and divided into two groups – Group A and Group B. The nature and duration of the study was explained to all the participants and written consent was obtained from each participant. The demographic and clinical data were collected from each participant. Pre-test level of upper extremity function was assessed through Fugl meyer assessment scale – Upper extremity and Motor Assessment Scale – Upper Limb with observation checklist, among interventional group on first day of the study. Mirror therapy and conventional therapy was demonstrated to group A and conventional therapy was demonstrated to group B. Participants of both the groups were practiced the techniques six days per week for twelve weeks. Post-test data was collected at the end of 12th week.
INTERVENTION:
In present study, Group A treated with mirror therapy with conventional therapy and Group B treated with conventional therapy. Participants of both the groups were received the selected treatment for 12 weeks.
TREATMENT PARAMETERS:
Duration of treatment: One hours per day
Frequency of treatment: Six days per week.
TECHNIQUES:
Group A: Mirror therapy with conventional therapy
The group A was treated with mirror therapy with conventional therapy.
- Mirror therapy:
Patient should be in front of mirror and practiced the following exercises by affected upper extremity:
- Range of motion exercises:
- Task or Activities:
2. Conventional Therapy:
i. Range of motion exercises:
ii. Stretching Exercises:
iii. Strengthening Exercises:
iv. Cryotherapy:
Group B: Conventional therapy
The group B was treated with Conventional therapy. The following exercises were given as conventional therapy:
i. Range of motion exercises:
ii. Cryotherapy:
iii. Stretching Exercises:
iv. Strengthening Exercises:
v. Task or Activities:
RESULT AND DATA INTERPRETATION
The present study was carried out to compare effectiveness of mirror therapy with conventional therapy versus conventional therapy alone to improve functional activity of upper extremity in chronic stroke patients. The level of upper limb functions and motor assessment was assessed by Fugl Meyer Assessment – Upper Extremity and Motor Assessment Scale – Upper Limb, respectively
MEAN IMPROVEMENT IN ALL THE PARAMETERS BETWEEN GROUP A AND GROUP B:
TABLE:
Group | N | Mean | Group | N | Mean | ||
FMA-UE | A | 15 | 29.20 | MAS-UL | A | 15 | 14.73 |
B | 15 | 16.53 | B | 15 | 10.07 |
GRAPH:
INTERPRETATION:
The above table shows the mean improvement in upper limb functional scores of FMA-UE was 29.20 in Group A and 16.53 in Group B. It was resulted that Group A treated with mirror therapy with conventional therapy had a superior effect in upper limb function scores over Group B treated with conventional therapy in upper limb function of chronic stroke patients.The above table shows the mean improvement in upper limb assessment scores of motor assessment scale – upper limb was 14.73 in Group A and 10.07 in Group B. It was resulted that Group A treated with mirror therapy with conventional therapy had a superior effect in upper limb function scores over Group B treated with conventional therapy in upper limb function of chronic stroke patients. Thus, the above study resulted that Group A treated with mirror therapy with conventional therapy had a superior effect in upper limb functions of chronic stroke patients.
DISCUSSION
The present study has done to evaluate the effectiveness of mirror therapy with conventional therapy versus conventional therapy alone to improve functional activity of upper extremity in chronic stroke patients.
In present study, total 30 chronic stroke patients with impaired upper limb functions were selected randomly and equally divided into two groups. Pre-test data were collected at the beginning of the study and post-test data were collected at the end of 12th week. The data were statistically analysed and comparing Group A and Group B, both the group showed significant improvement in upper limb functions, but Group A not only showed greater improvement but also recorded a high degree of consistency with ‘t’ values and as seen in graph showing mean improvement of both the parameters, there is greater improvement in mean of upper limb function and upper limb motor assessment in Group A.
In present study, Group A had a mean age of 59.20 years and Group B had a mean age of 59.80 years.
The study was to comparing the mirror therapy with conventional therapy and conventional therapy alone in improving upper limb motor assessment of chronic stroke patients. The upper limb motor assessment score of each stroke patient was assessed by using motor assessment scale – upper limb (MAS-UL) before the start of the treatment as pre-test values and at the end of 12th week as post-test values. The mean of pre-test and post – test values were 6.60 and 21.33, respectively in group A and 6.26 and 16.33, respectively in group B. The mean improvement in upper limb motor assessment score of group A and group B was 25.00 and 13.85, respectively. The statistical analysis correlates the study by proposing that groups taken for study either Group A treated by mirror therapy with conventional therapy or Group B treated by conventional therapy alone showed significant effect in improvement in upper limb motor assessment functions.
Thus, the study resulted that Group A treated with mirror therapy with conventional therapy had a superior effect in improving upper limb functions when compared to Group B treated with conventional therapy. In favour to present study Yavuzer et al. (2008) and Thieme et al. (2013) who concluded that hand functioning improved more after mirror therapy in addition to a conventional rehabilitation program. Wen Samuel et al (2014), Lim et al. (2016), Perez-Cruzado et al. (2017) and Wen Zeng et al. (2017) were also concluded that mirror therapy significantly improve motor function of the upper limb in stroke patients. The similar result found in another study showed that mirror therapy after stroke was a promising method to improve sensory function, passive joint motion in a hemiparaesis upper limb. (Sathian et al., 2000). This study finding was consistent with the result of another study showed that the mirror therapy was significantly helps to improve motor performance, sensory function, passive joint motion and joint pain of the upper extremity ( Holm et al., 2018).51
Based on data, the Group A treated by mirror therapy with conventional therapy had a superior effect in improving upper limb functions when compared to Group B treated with conventional therapy alone. Thus, alternative hypothesis is accepted.
CONCLUSION
The result of the present study concluded that mirror therapy with conventional therapy was more effective than conventional therapy alone to improve functional activities of upper extremity in chronic stroke patients. The study also revealed that mirror therapy with conventional therapy is a safe and effective technique to treat upper extremity dysfunction in chronic stroke patients.
REFERENCES
- Warlow C, Sudlow C, Dennis M, Wardlaw J, Sandercock P. (2003). Stroke. Lancet; 362: 1211-24.
- Altschuler, E.L., Wisdom, S.B., Stone, L., Foster, C., Galasko, D., Llewellyn, D.M., & Ramachandran, V.S. (1999). Rehabilitation of hemiparesis after stroke with a mirror. Lancet, 353(9169): 2035-2036.
- Bonita R, Mendis S, Truelsen T, Bogousslavsky J, Toole J and Yatsu F (2004). The global stroke initiative. Lancet Neurol.;3(7): 391-3.
- World Health Organization (2001). International classification of functioning, disability and health (online). 2001. www.who.int/classification/icf/en/ Last accessed 12 January, 2019.
- Adamson J, Beswick A and Ebrahim S (2004). Is stroke the most common cause of disability? J Stroke Cerebrovasc; 13:171-7.
- Langhorne P, Stott D, Robertson L, MacDonald J, Jones L, McAlpine C et al. (2000). Medical complications after stroke – Multicenter study. Stroke; 31: 1223-9.
- Wade D, Langton Hewer R, Skilbeck C and David R (1985). Stroke: a critical approach to diagnosis, treatment and management. London: Chapman & Hall, 1985.
- Anand, K., Chowdhury, D, & Singh, K.B. (2001). Estimation of Mortality and Morbidity due to Strokes in India. Journal of Neuroepidemiology, 20(6): 208- 211.doi:10.1159/000054789.
- Dhamija, R.K., Sarika, A., Gaba, P., Jais, M., Kaintura, A., Kumar, M., et al. (2008). Study of genetic, metabolic and inflammatory risk factors in patients of acute ischemic stroke. Indian Journal of Clinical Biochemistry, 23(2): 136-143.
- Kwakkel G, Kollen BJ, van der Grond J and Prevo AJ. (2003). Probability of regaining dexterity in the flaccid upper limb: impact of severity of paresis and time since onset in acute stroke. Stroke; 34: 2181-6.
“A COMPARATIVE STUDY ON THE EFFECTIVENESS OF SPECIFIC BALANCE STRATEGY VERSUS CONVENTIONAL BALANCE TRAINING TO IMPROVE BALANCE IN MULTIPLE SCLEROSIS PATIENTS – A RANDOMIZED CONTROLLED TRIAL.”
Dr. Arushi Tandon, B.P.T, Dr. Pragya Bhatt, M.Sc Anatomy (Medical)
ABSTRACT
BACKGROUND: Multiple sclerosis happens to be the most common neurological affliction among adults between the age of 20 and 40, with over 40,000 cases in India. MS in this series affects patients of all communities and different dietary habits. It is more common in the higher socioeconomic group. Patients with MS participate in exercise programmes to improve their balance but no study has investigated a specific balance strategy training intervention presented in a workstation format for small groups.
OBJECTIVE: to compare whether a specific balance strategy training programme delivered in a workstation format was superior to a conventional exercise programme for improving balance in patients with MS.
METHODOLOGY: after satisfying inclusion and exclusion criteria the subjects were randomly selected and assigned to two groups, group 1(conventional group) consisting of
15 patients which received conventional therapy which includes gentle stretches, co ordination exercises, strengthening exercises for lower limbs, controlled mobility exercises and biofeedback mirror. Group 2(experimental group) consisting of 15 patients which received specific balance strategy which includes several workstation tasks which are designed to improve functional abilities, improve upper and lower limb strength, teach multi tasking and provide vestibular stimulation along with the conventional therapy mentioned above. The treatment was given 4 days a week for 3 weeks.
RESULTS: all participants significantly improved in their balance (P<0.0000). The specific balance strategy intervention group showed significantly more improvement in functional measures than the control group (P=0.00341) with respect to BBS. Separate group analyses indicated slight to no improvement in performance in timed gait (P=0.710) with respect to timed up and go. The control group as well as the experimental group showed improvement in TUG.
CONCLUSION: the results provide evidence that all participants achieved a significant improvement in balance. Specific balance strategy training using workstations is superior to traditional exercise classes for improving function and balance.
KEY WORDS: randomised controlled trial, balance, functional ability, exercise, workstations, multiple sclerosis.
TABLE OF CONTENTS
SL NO | TITLE | PAGE NO |
1 | Introduction | 1-10 |
2 | Objectives | 11-12 |
3 | Review of literature | 13-20 |
4 | Materials and Methodology | 21-27 |
5 | Results | 28-42 |
6 | Discussion | 43-46 |
7 | Conclusion | 47 |
8 | Summary | 48 |
9 | Bibliography | 49-53 |
10 | Annexure | 54-62 |
LIST OF TABLES
SL NO | TABLE | PAGE |
1 | Inter group comparison of age of patients | 30 |
2 | Inter group comparision of age of the patients. | 31 |
3 | Inter group comparison of gender of the patients. | 33 |
4 | Intra group comparison with to the Berg balance scale. | 35 |
5 | Inter group comparison of the Berg balance scores | 36 |
6 | Intra group comparison with the Timed up and go scores | 38 |
7 | Inter group comparison with the timed up and go test. | 39 |
8 | Gender and its effect on the outcome tools. | 41 |
9 | Age and outcome tools. | 42 |
LIST OF FIGURES
Sl No | Title | Page |
1 | List of Pictures Normal nerve and demyelinated nerve Subtypes of Multiple sclerosis MRI of brain affected with multiple sclerosis Tools used for the study Conventional set of exercises Hip extension being performed by the patient Forward reaching task The specific balance strategy exercises. List of Graphs Age groups of the patients in the experimental and control group. Different gender in both the groups. Pre and post test comparison for both the groups with berg balance scale Pre and post test comparison for both groups with timed up and go test. | 2 |
2 | 4 | |
3 | 6 | |
4 | 23 | |
5 | 24 | |
6 | 25 | |
7 | 25 | |
8 | 26 | |
1 | 32 | |
2 | 34 | |
3 | 37 | |
4 | 40 |
INTRODUCTION
Multiple sclerosis is an unpredictable disease that varies greatly from one individual to another in term of clinical presentation and the severity of symptoms presented. The onset typically occurs between the ages of 15 to 55 years, with the peak in the third decade. The disease is rare in children, as is the onset of symptoms in adults over the age of 50 years 1.
The prevalence of MS in India is low, and it is unclear whether the manifestations of the disease in India are similar to the United States. It happens to be the most common neurological affliction among adults between the age of 20 and 40, with over 40,000 cases in India, according to the survey done by India today magazine, 27th April 2009 issue. No Indian patient had a family history of MS; this suggests an environmental disease-triggering agent 2. The calculations based on the hospital data suggest an approximate prevalence rate of 0.17 to 1.33 per 100,000 of population in different parts of India. The incidence in females is twice that in males. The optico-spinal form of MS is the commonest (71.4%) in India. Multiple sclerosis in this series affects patients of all communities and different dietary habits. MS is more common in the higher socioeconomic group whereas neuromyelitis optica, a similar condition, is mainly seen in patients in the low socioeconomic group 3.
Multiple sclerosis is defined as, a progressive disease characterized by disseminated demyelination of nerve fibres of the brain and spinal cord. Begins slowly, usually in young adulthood continues throughout life with periods of exacerbation and remission 1. Clinically MS is characterised by multiple signs and symptoms and fluctuating periods of exacerbation and remission. An exacerbation involves a relapse or
period of symptom flare up, whereas a remission is a period free of evolving symptoms. The course of the disease is highly unpredictable. In the early stages, relatively complete remission of initial symptoms may occur; however, as the disease progresses, the remissions may become less complete with increased neurological dysfunction and complications that affect multiple body systems 1.
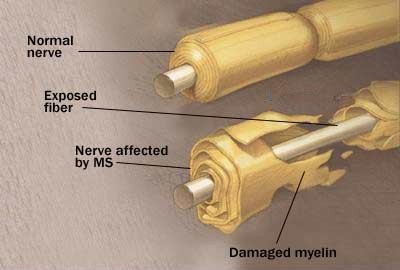
Fig.1 Normal nerve and demyelinated nerve
Conduction through the myelinated pathways in the central nervous system is saltatory, individual axons transmitting fast trains of impulses. Myelin injury blocks conduction and although function may be preserved by redundancy in individual systems or tracts, strategically placed pathways may lose their safety margin, resulting in neurological symptoms and signs as seen in Multiple sclerosis 4.
Viral infections trigger the production of lymphocytes (T cells, B cells) and macrophages, which in turn appear to produce cytotoxic effects within the central nervous system. Reactive astrogliosis results in destruction of oligodendrocytes (myelin-
producing cells) and the myelin sheath that surrounds the nerve. Disruption of the myelin sheath (demyelination) slows neural transmission and causes nerve to fatigue rapidly. With severe disruption, conduction block occurs with disruption of function. Local inflammation, oedema and infiltrates surround the acute lesion and cause a mass effect, further interference with the conductivity of the nerve fibre. During the early stages of MS, remaining oligodendrocytes may survive the initial insult and produce remyelination. As the disease becomes more chronic, no oligodendrocytes are preserved, and remyelination does not occur. The demyelinated areas eventually become filled with fibrous astrocytes and undergo a process called gliosis. Gliosis refers to the proliferation of neuroglial tissue within the CNS those results in glial scars (plaques). They primarily affect white matter, although lesions in grey matter are seen in advanced disease1.
In 1996 the United States National Multiple Sclerosis Society standardized four subtype definitions;
Relapsing remitting Secondary progressive Primary progressive Progressive relapsing
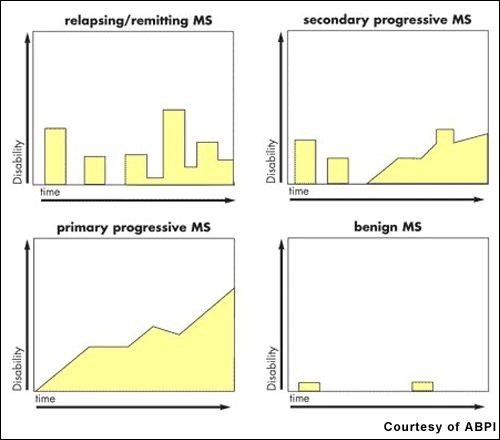
Fig.2 Subtypes of Multiple sclerosis.
Partially demyelinated axons may discharge spontaneously, thus accounting for many unpleasant distortions of sensation reported by a high proportion of patients. Increased mechanical sensitivity manifests as movement induced symptoms, including flashes of lights provoked by eye movement and the electric sensation that spreads down the spine, limbs or anterior chest wall after neck flexion-Lhermitte’s sign 4.
Therefore most frequent symptoms of MS being 5
Fatigue-88%
Walking problems-87%
Bowel and bladder problems-65% Pain and other sensations-60% Visual disturbances-58% Cognitive problems-44% Tremors-41%
Multiple sclerosis can be difficult to diagnose since its signs and symptoms may be similar to many other medical problems. Medical organizations have created diagnostic criteria to ease and standardize the diagnostic process for practicing physicians. Currently, the McDonald criteria focus on a demonstration with clinical, laboratory and radiologic data of the dissemination of MS lesions in time and space. Most commonly used diagnostic tools are neuroimaging, analysis of cerebrospinal fluid and evoked potentials. Magnetic resonance imaging of the brain and spine shows areas of demyelination (lesions or plaques). There are certain areas of predilection, such as the optic nerve, sub cortical (especially periventricular) white matter, corticospinal tracts, posterior white column of the spinal cord and cerebellar peduncles. Testing of cerebrospinal fluid obtained from a lumbar puncture can provide evidence of chronic inflammation of the central nervous system. The cerebrospinal fluid is tested for oligoclonal bands, which are an inflammation marker found in 75% to 85% of people with MS. The nervous system of a person with MS often responds less actively to stimulation of the optic nerve and sensory nerves due to demyelination of such pathways. These brain responses can be examined using visual and sensory evoked potentials 17.
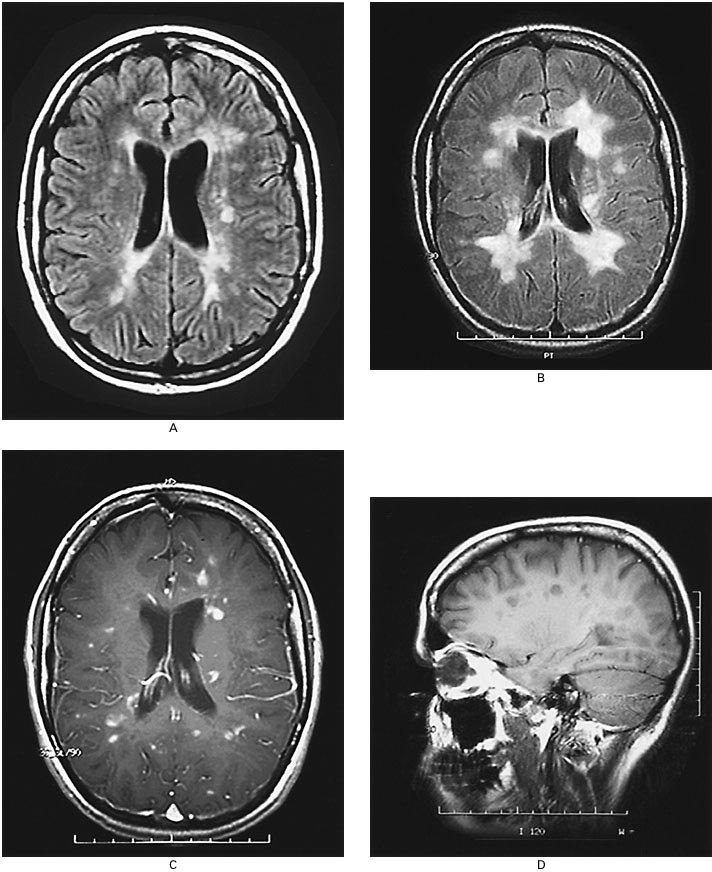
Fig.3 MRI of brain affected with multiple sclerosis.
Abnormalities in balance control are common findings in people with multiple sclerosis and can along with other risk factors increase risk of falls. These abnormalities, together with other impairments and disabilities, often prevent people from performing their daily living activities. In the past decade much attention has been directed towards the rehabilitation of balance in elderly people. Recently the assessment and the treatment of balance and gait impairments in multiple sclerosis have gained more interest within the scientific community7. Patients with multiple sclerosis fall inside their homes and outside in the community. They show a decline in ability to maintain balance when faced with the
perturbations imposed by functional requirements such as dividing attention between tasks as is needed to keep balance when walking in a crowd or on a busy road crossing. Declines in sensory (vision, vestibular and proprioception) and motor (strength, coordination, endurance) function and integration (response time, multi-task ability) have been identified as the major intrinsic factors contributing to falls 8, 10-15.
Keeping the body in balance involves many messages going to and from the brain. Even standing still, the body is constantly adjusting to the environment and making tiny changes. Multiple sclerosis causes damage to the many areas of the central nervous system that can impact postural responses to maintain balance, including the cerebellum and spinal cord 9. Cerebellar problems are common in MS. Balance and co ordination problems predispose the individuals to falls. Ataxia, in coordination, dysmetria and tremor that become exaggerated with movement may be present in all the extremities and trunk 6.
Spasticity can have a significant impact on function in MS patients. It can accompany weakness or interfere with functions despite relative normal strength. It coexists with weakness and may present as phasic spasms or sustained increase in tone. Spasticity can interfere with mobility and may also cause pain, predispose the individual to contractures and lead to poor postures 6. Weakness is a common finding in individuals with MS and a frequent cause for impairment. With lower extremity involvement, patients will typically describe worsening balance during ambulation and the need to hold on to walls or furniture.
During ambulation, patients will typically display a wide based gait with worsening balance when initiating gait or changing direction. The proximal muscles and the trunk muscles are much more frequently involved in MS which results in loosing balance during the day to day activities 16. Decreased strength results from several causes:
upper motor neuron weakness, fatigue, disuse, compensatory movements, pain and overriding spasticity in an antagonistic muscle. Pain frequently associated with MS is caused by spasticity, poor posture or abnormal use of muscles to compensate for loss of function. Contractures, disuse atrophy, decubitus ulcer and risk of falls and loss of balance are known complications of MS leading to increased dependency 6.
The primary aims of the therapy are returning functions after an attack, preventing new attacks and preventing disabilities. Both drug therapy and neuro-rehabilitation have shown to ease the burden of some symptoms, even though neither influences disease progress. A multidisciplinary approach is the key to limiting and overcoming disabilities10.
In physical therapy, conventional therapies given for balance includes, static holding in different weight bearing positions, progression through series of postures, joint approximation techniques and rhythmic stabilization(Proprioceptive Neuromuscular Facilitation),controlled mobility activities, strengthening the fixating muscles, visual cues, Swiss ball exercises , Frenkels exercises etc 1.
Previous research has shown that exercise such as strength, flexibility, balance training, Tai Chi and combinations of these activities delivered in a class situation or individually have increased strength, improved balance and improved functional ability in addition to reducing risk of falls. A multi-focus rather than a sole physical intervention approach appears to be superior in reducing falls. Thus, including fall prevention education, home evaluation and modification, medical review of physical status and medication in conjunction with an exercise programme has been shown to be most beneficial 8.
In this experimental approach, each workstation is designed to focus on a specific task that addresses aspects required for balance including functional strength, flexibility, balance strategy practice, sensory integration, and added attention demands during function and multi-task practice. Each station task is graded to cater to various levels of ability so that participants can have the level of difficulty progressed to increase the challenge. This versatility of degree of difficulty also allows for accommodation to various levels of ability of individual participants. In the workstation situation, the physiotherapist positions to ensure safety. Another advantage of the workstation application is the encouragement of self-efficacy in the participants who take control of their programme by remembering what task to practise and how to increase the challenge at each station after consultation with the physiotherapist 8.
Berg balance scale and time up and go test have acceptable concurrent validity in testing static and dynamic stability in individuals with multiple sclerosis 41, 42.
Recent evidence supports that specific balance strategy training using workstations is studied, to be effective for improving function and balance 8. No previous studies have investigated the efficacy of a specific balance strategy-training programme presented through a workstation or circuit programme as the exercise intervention for improving the balance in people with multiple sclerosis. This study focuses to evaluate the effects of balance retraining in a population of people with multiple sclerosis with this specific balance strategy.
NEED FOR THE STUDY
Multiple sclerosis happens to be the most common neurological affliction among adults between the age of 20 and 40 and most common cause of disability among the adults & makes an important contribution to the morbidity, mortality and disability in developing as well as developed countries. Very fewer studies have investigated the efficacy of a particular set of balance programme as the strategy to improve balance in multiple sclerosis. No study has been done to find the efficacy of the specific balance strategy-training programme as the exercise intervention in multiple sclerosis patients. Therefore the need of the study arises to compare the effectiveness of specific balance training strategy with conventional balance exercises in multiple sclerosis patients.
OBJECTIVE OF THE STUDY
- To evaluate the effects of specific balance strategies in multiple sclerosis patients.
- To evaluate the effects of conventional balance strategies in the multiple sclerosis patients.
- To compare the efficacy of specific balance strategies over the conventional balance strategies.
HYPOTHESIS:
Experimental Hypothesis:-
The specific balance strategy may have a significant result in regaining balance in multiple sclerosis patients than the conventional balance strategies.
Null Hypothesis:-
The specific balance strategy may not have a significant result in regaining balance in multiple sclerosis patients than the conventional balance strategies.
MATERIALS AND METHODOLOGY
Source of data:
- Justice K.S.Hegde Charitable Hospital, Deralakatte, Mangalore.
- Private clinics (Physiotherapy) from Mangalore and Bangalore
Sampling procedures:
By using randomised sampling techniques
Design:
Randomized Experimental study design.
Subjects: Thirty patients with multiple sclerosis satisfying the inclusion criteria were selected for the study.
Group 1: Consisting of 15 patients who received conventional therapy which includes gentle stretches, co ordination exercises, strengthening exercises for lower limbs, controlled mobility exercises and biofeedback mirror.
Group 2: Consisting of 15 patients who received specific balance strategy which includes several workstation tasks which are designed to improve functional abilities, improve upper and lower limb strength, teach multi tasking and provide vestibular stimulation along with the conventional therapy mentioned above.
Method of Collection of Data:
SUBJECT SELECTION CRITERIA
Inclusion criteria
- Multiple sclerosis with motor balance disorders
- Relapsing – remitting type of multiple sclerosis.
- Ability to stand independently for more than 30 sec and ability to walk for 6m.[7]
- 25-55 age
- Both females and males
Exclusion Criteria
- Medically unstable patients.
- Non co-operative.
- Severe sensory involvement or sensory ataxia.
- Any musculoskeletal deformities.
- Vestibular involvement
- Peripheral nerve involvement.
- Progressive type of multiple sclerosis
Materials:-
-
- Chair
- Cup and saucer
- Mirror
- Soft mat
- Small objects like balls, toys etc
- Blocks of different heights tables
- Inflated beach balls, hard balls
- Pack of cards
- Ankle cuffs
Fig 4 Materials used. Ankle cuff, balls, cup and saucer and pack of cards.
OUTCOME TOOLS
-
- Timed up and go test.
- Berg balance scale.
Procedure :
30 patients were selected by using randomized controlled technique after fulfilling the criteria from the population and then divided into two groups. Each group consist of 15 patients. A written consent was taken from the patient after explaining about the intervention procedure and ethical clearance was obtained from the ethical committee of K S Hegde Medical Academy.
The mean ages in both the groups were 38. The maximum numbers of patients (26.7%) were in the age group 51-55. Equal number of males (7) and females (8) were taken in both the experimental and control group.
Group 1 received conventional balance training which includes gentle stretches, coordination exercises, strengthening exercises for lower limbs, controlled mobility exercises and biofeedback mirror.
The conventional exercises are explained below 8:
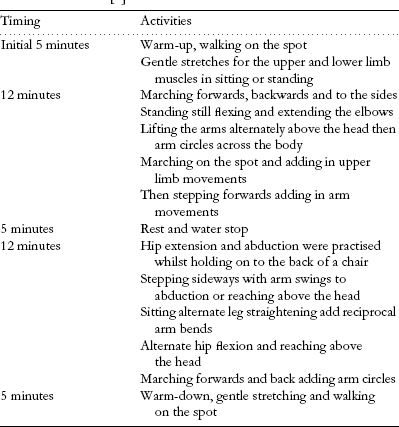
Fig.5 table showing conventional set of exercises.
Balance progressed with easiest (with support) to most difficult (without support). The interventions were given for 45 minutes a day for 4 days a week and for 3 weeks with adequate rest period 7.
Fig 6: Hip extension being performed by the patient, part of the conventional balance exercise.
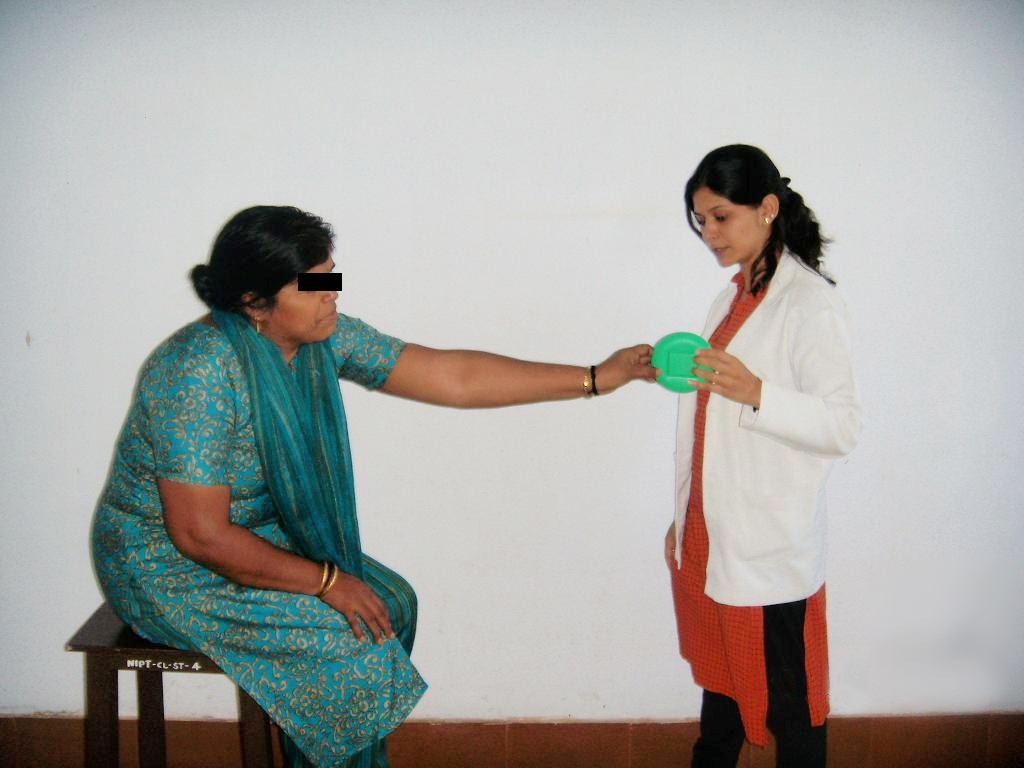
Fig 7: Forward reaching task, part of the specific balance strategy, being performed by the patient.
Group 2 received specific balance strategy which included several workstation tasks which were designed to improve functional abilities, improve upper and lower limb strength, teach multi tasking and provide vestibular stimulation 8
The workstations are explained in the table below 8:
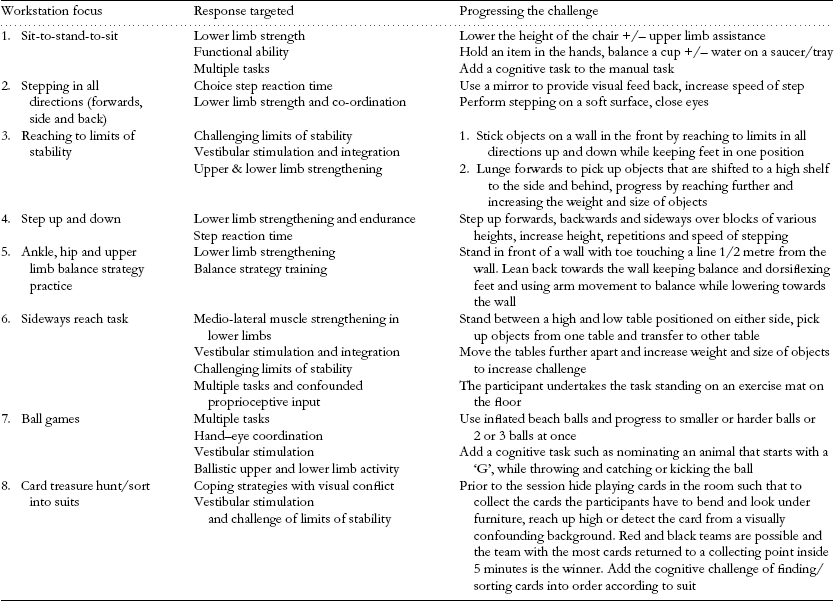
Fig.8 The specific balance strategy exercises.
These exercises are progressed gradually, the progression is made when subject performs task easily without any loss of balance. The interventions were given for 45 minutes a day for 4 days a week and for 3 weeks with adequate rest period 7.
Before and after the intervention for both the groups’ pre and post test score will be obtained for the balance using berg balance scale and timed up and go test. Berg balance test is a 14 item scale designed to measure balance of the adults in a clinical setting. It consists of a 5 point ordinal scale, ranging from 0-4. “0” indicates the lowest level of function and “4” the highest level of function. Total Score = 56. Authors support a cut off score of 45/56 for independent safe ambulation. The drawback of this scale is that it does not include gait item. Timed up and go test is a test for basic functional mobility. Normal healthy elderly usually complete the task in ten seconds or less. Very frail or weak elderly with poor mobility may take 2 minutes or more. Results correlate with gait speed, balance, functional level, the ability to go out, and can follow change over time.
DATA ANALYSIS AND RESULTS:
The data of the improvement in the balance within both the groups were analysed with the help of paired “t” test. The inter group analysis was done with the help of unpaired “t”test. For comparing the scores obtained with the timed up and go test within the groups Wilcoxon signed rank test was used and for inter group analysis Mann- Whiteny U test was used. The formulae of the tests used are as follows:
- Paired “t” test:
∑ = Sum
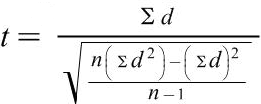
n = sample size
d = difference between variables
- Unpaired “t” test
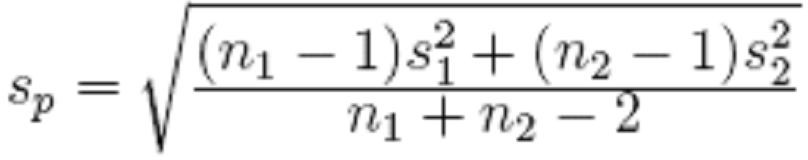
For experimental group, group 1 Sample size= n1
Sample mean= x1
Sample stadard deviation= s1 For control group, group 2 Sample size= n2
Sample mean= x2
Sample stadard deviation= s2
- Wilcoxon signed rank test.
![]() (W— W)±.5
(W— W)±.5
z =
![]() W
W
Where,
W= sum of signed ranks
µw = 0
![]() w= variable of the signed ranks.
w= variable of the signed ranks.
- Mann – Whitney U test
U1 = n1 .n2 + n1(n1+1) – R1
2
Where n1 is the two sample size for sample 1, and R1 is the sum of ranks in sample 1 U2 = n1 .n2 + n2(n2+1) – R2
2
Where n2 is the sample size for sample 2, & R2 is the sum of the ranks in sample 2 The sum of the two values is then given by
U1 + U2 = n1.n2 + n1 (n1+1) – R1+ n1.n2 + n2 (n2+1) – R2
2 2
Where,
n1 = sample size for control group
n2 = sample size for experimental group R1 = sum of ranks in control group
R2 = sum of ranks in experimental group U = Mann- Whiteny U test value.
Table 1
Inter group comparison of age of patients
Group | Total | |||
Experimental | Control | |||
Age | 21 – 25 | 0 .0% | 2 13.3% | 2 6.7% |
26 – 30 | 1 6.7% | 1 6.7% | 2 6.7% | |
31 – 35 | 2 13.3% | 2 13.3% | 4 13.3% | |
36 – 40 | 2 13.3% | 2 13.3% | 4 13.3% | |
41 – 45 | 3 20.0% | 2 13.3% | 5 16.7% | |
46 – 50 | 3 20.0% | 2 13.3% | 5 16.7% | |
51 – 55 | 4 26.7% | 4 26.7% | 8 26.7% | |
Total | 15 100.0% | 15 100.0% | 30 100.0% | |
Table 1 shows the different ranges of the age of the patients. The mean age of the group is
38. Maximum percentages 26.7% of people lie in the age group of 51-55 in both experimental and control group.
Table 2
Inter group comparision of age of the patients.
Group | N | Minimum | Maximum | Mean | Std. Deviation | Median | t value | p value |
Age Experimental | 15 | 30 | 54 | 43.67 | 8.321 | 43.00 | .669 | .509 |
Control | 15 | 23 | 55 | 41.27 | 11.119 | 45.00 | NS | |
Total | 30 | 23 | 55 | 42.47 | 9.726 | 44.00 |
Table 2 shows inter group comparison with respect to age, 43.67 is the mean age in the experimental group and 8.321 is the standard deviation. In the control group mean age being 41.27 with a standard deviation of 11.119. With unpaired “t” test, the “t” value obtained was 0.669 with a p value 0.509. The p value is not significant this implies that the study is not biased with age factor.
Graph1 depicts that the maximum number of patients were of the age group 51-55 both in the experiment and control group. The least number of patients found were of the age group 26-30.
Graph 1
Age groups of the patients in the experimental and control group.
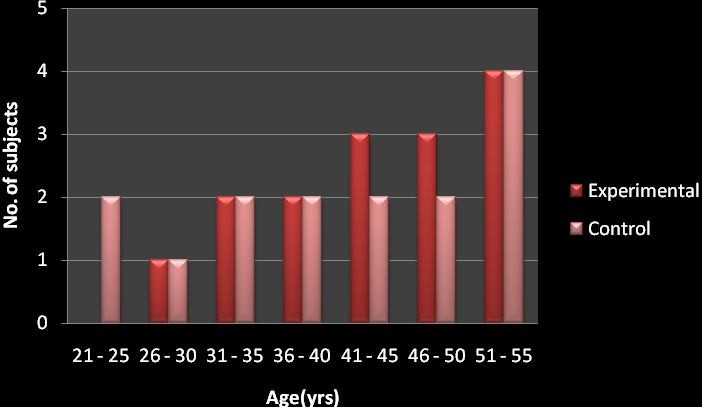
Table 3
Inter group comparison of gender of the patients.
Group | Total | |||
Experimental | Control | |||
Sex | Female | 8 53.3% | 8 53.3% | 16 53.3% |
Male | 7 46.7% | 7 46.7% | 14 46.7% | |
Total | 15 100.0% | 15 100.0% | 30 100.0% | |
The table shows the inter group comparison of the gender of the patients. 53.3% of the patients being females and 46.7% being males in both experimental and control group. This implies that the study is not biased with the gender of the patients either.
Graph 2 depicts the same, showing equal number of females and males in both the experimental and control group.
Graph 2
Different gender in both the groups.
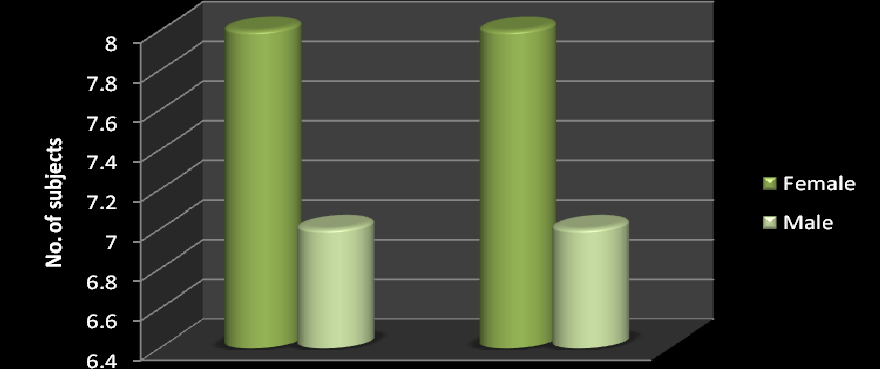
Table 4
Intra group comparison with to the Berg balance scale.
Group | N | Min | Max | Mean | Std. Deviation | Median | Mean Difference | t value | p value | |
Experimental | Pre BBS | 15 | 19 | 42 | 30.87 | 5.167 | 30.00 | 5.4000 | 8.259 | .000 |
Post BBS | 15 | 28 | 49 | 36.27 | 5.351 | 35.00 | HS | |||
Control | Pre BBS | 15 | 28 | 35 | 31.40 | 2.324 | 30.00 | 3.000 | 5.434 | .000 |
Post BBS | 15 | 31 | 36 | 34.40 | 1.502 | 35.00 | HS |
The experimental group receiving the specific balance strategy has shown improvement from a mean score of 30.87 to 36.27. Mean difference of improvement being 5.400. The t value is 8.259 and p value being 0.000. The control group also shows an improvement from 31.40 to 34.40. The mean difference here is 3.000. The t value is
5.434 and the p value is 0.000. Thus the statistics shows an improvement in both the experimental group and the conventional group in their pre and post scores.
Table 5
Table showing inter group comparison of the Berg balance scores
m
Group | N | Minimum | Maximu | Mean | Std. Deviation | Median | t value | p vale |
Effect(Pos Experime Pre) BBS Control | 15 15 | 1 0 | 9 6 | 5.40 3.00 | 2.063 2.138 | 5.00 2.00 | 3.200 | .00341 HS |
The mean value in the experimental group is 5.40 and the mean value in the control group is 3.00 with a t value of 3.200 and p value of .00341. Thus the study shows a significant improvement in both the groups. But when the scores are compared with each other the experimental group score shows more improvement.
The graph 3 also denotes the same. In both the control and experimental the post intervention scores are higher than the pre. Showing a significant improvement, but the experimental group shows a better improvement in comparison to the control group.
Graph 3
Pre and post test comparison for both the groups with berg balance scale.
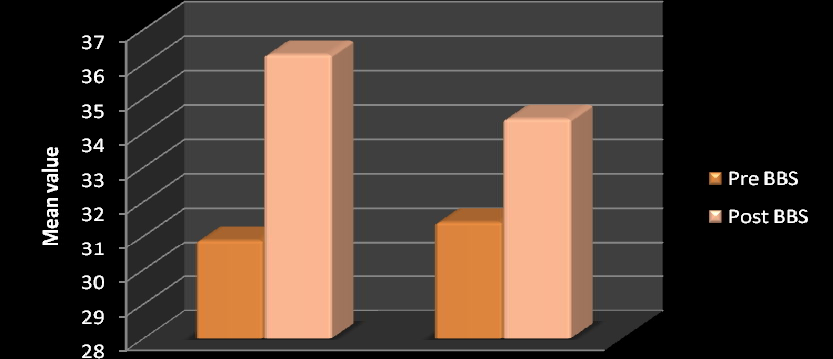
Table 6
Table shows intra group comparison with the Timed up and go scores
Group | N | Minimum | Maximum | Mean | Std. Deviation | Median | Wilcoxon Signed Ranks Test z value | p vale |
Experimen Pre TUG Post TUG | 15 15 | 1 1 | 2 2 | 1.80 1.40 | .414 .507 | 2.00 1.00 | 2.449 | .014 sig |
Control Pre TUG Post TUG | 15 15 | 1 1 | 2 2 | 1.73 1.40 | .458 .507 | 2.00 1.00 | 2.236 | .025 sig |
The mean value of the timed up and go in the experimental group has shown an improvement from pre value of 1.80 to post value of 1.40 with a z value of 2.449 and p value of 0.014. The mean value of the same in the control group has shown an improvement from pre value of 1.73 to post value of 1.40 with a z value 2.236 and p value of 0.025. Thus both the group are showing significant improvement within, with respect to the timed up and go test.
Table 7
Inter group comparison with the timed up and go test.
Group | N | Minimum | Maximum | Mean | Std. Deviation | Median | Mann- Whitney U test Z value | p vale |
Effect(Post- Experiment Pre) TUG Control | 15 15 | 0 0 | 1 1 | .40 .33 | .507 .488 | .00 .00 | .372 | .710 NS |
The mean value in the experimental group is 0.40 and in the control group is 0.33. The z value with the Mann Whitney U test is 0.372 giving a p value of 0.710. This shows that the interventions have not brought a significant result when compared between both the groups. The graph 4 indicates the same.
Graph 4
Pre and post test comparison for both groups with timed up and go test.
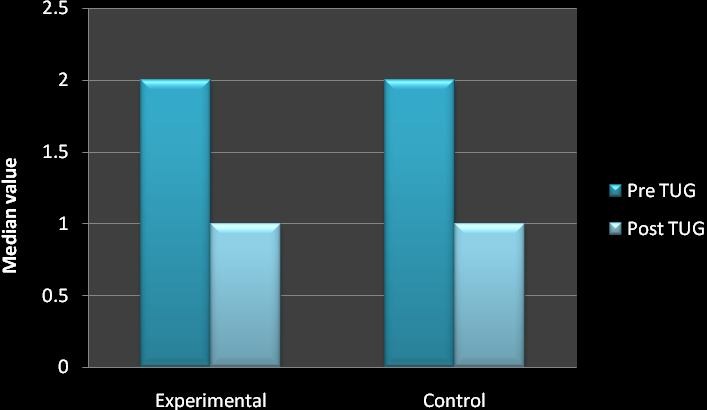
Table 8
Gender and its effect on the outcome tools.
Group Sex | N | Minimum | Maximum | Mean | Std. Deviation | Median | Mann- Whitney U test Z value | p value | |
Experiment Effect(Post-Pre) Female BBS Male | 8 7 | 2 1 | 7 9 | 5.63 5.14 | 1.685 2.545 | 5.50 5.00 | .709 | .478 NS | |
Effect(Post-Pre) Female TUG Male | 8 7 | 0 0 | 1 1 | .50 .29 | .535 .488 | .50 .00 | .816 | .414 NS | |
Control | Effect(Post-Pre) Female BBS Male | 8 7 | 1 0 | 6 6 | 3.38 2.57 | 2.134 2.225 | 3.00 2.00 | .765 | .444 NS |
Effect(Post-Pre) Female TUG Male | 8 7 | 0 0 | 1 1 | .38 .29 | .518 .488 | .00 .00 | .354 | .724 NS | |
As shown in the table above, the mean values are taken to find out the effect of the gender of the patients on the interventions, in regards to both the outcome tools. The z value in the experimental is 0.709 and p value 0.478 with BBS and z value 0.816 and p value 0.414 with TUG. The z value in the control group is 0.765 and p value 0.444 with BBS and z value0.354 and p value 0.724 with TUG. Thus it shows that the p value is not significant. This means that the study is free from gender bias.
Table 9
Age and the outcome tools.
Correlations
Group | Spearman’s rho | p | ||
Experimenta | Age Effect(Post-Pre) BBS Effect(Post-Pre) TUG | -.239 -.411 | .392 .128 | NS NS |
Effect(Post- Effect(Post-Pre) TUG Pre) BBS | .257 | .355 | NS | |
Control | Age Effect(Post-Pre) BBS Effect(Post-Pre) TUG | -.034 .180 | .905 .520 | NS NS |
Effect(Post- Effect(Post-Pre) TUG Pre) BBS | .366 | .179 | NS | |
The table above correlates the effect of the age of the patients on the outcome tools. The p value in the table indicates that the age does not have any effect on the outcome tools. Thus both the outcome tools are independent from each other and thus the study is not biased.
DISCUSSION
This study was designed to find out and compare the effectiveness of specific balance strategy and conventional balance training in improving balance in multiple sclerosis patients.
Conventional balance training included gentle stretches, coordination exercises, strengthening exercises for lower limbs, controlled mobility exercises and biofeedback mirror. While the specific balance strategy involved various workstations designed to focus on a specific task that addresses aspects required for balance including functional strength, flexibility, balance strategy practice, sensory integration, and added attention demands during function and multi-task practice. The study involved 30 patients with multiple sclerosis, who fulfilled the inclusion criteria. They were then randomly divided into group 1 and group 2. Conventional balance training was applied on group 1 and group 2 received the specific balance strategy. The 45 minutes sessions was given 4 days a week for 3 weeks.
The results showed that there was a significant improvement in the experimental group (group 2) from 30.87 to 36.27 with a mean improvement value of 5.40. The improvement shown here is highly significant with the t value of 8.259 and p value 0.000. This improvement shown was scored with the help of Berg balance scale. While with the timed up and go score which was measured with the help of Wilcoxon Sign Rank test, the z value was 2.449 and the p value 0.014. This shows that the scores were significant with the timed up and go test. This is further supported by D Cattaneo, J Jonsdottir, M Zocchi et al; balance rehabilitation appeared to be a useful tool in reducing the fall rate and improving balance skills in subjects with multiple sclerosis. Exercises in different sensory contexts have an impact in improving dynamic balance 7. Lord SE, DT Wade, P
W Halligan et al; in their study on MS concluded that task oriented approach and facilitation approach helped in improving walking in patients with gait disturbance 36. Romberg A, Virtanen A, Ruutiainen J et al; walking speed improved in this randomized study with the help of set of exercises including strengthening, aerobic training and task oriented approach. The results confirm that exercise is safe for multiple sclerosis patients and should be recommended for those with mild to moderate disability. Tasks related with balance give better results with respect to intervention on strength of lower limbs or aerobic exercises 35. Fulk GD, said that impaired walking ability, balance, and fatigue are common problems for people with multiple sclerosis (MS) and all of the above symptoms could be managed with task oriented, skilled and intensive rehabilitation31.
The results showed that there was an improvement in the conventional group (group 1) as well. The scores showed improvement from 31.40 to 34.40 with a mean improvement value of 3.00. The improvement shown here also is highly significant with the t value of 5.434 and p value 0.000. This improvement shown was scored with the help of Berg balance scale. While with the timed up and go score which was measured with the help of Wilcoxon sign rank test, the z value was 2.236 and the p value 0.025. This shows that the scores were significant with the timed up and go test. Therefore there was a significant improvement with the conventional set of exercises as well. This can be supported by the following studies, Smedal T, Lygren H, Myhr KM et al; indicated that balance and gait can be improved after physiotherapy based on the Bobath concept30. DeBolt L, & McCubbin, J concluded that the home-based resistance program was well tolerated by participants and offered a practical means to improve leg extensor power in a short period of time 34. (Kraft, Alquist, Lateur) 6; used a progressive resistance training
regimen and demonstrated improved muscle strength in upper and lower extremities. Therefore showed improved gait parameters.
In the inter group analysis, both the groups showed improvement in the balance, which was proven by the unpaired t test. The mean difference was 2.40 with a t value of
3.200 and p value of 0.00341 with respect to the berg balance scale. With the time up and go test the mean difference was 0.07, z value 0.371 and p value 0.710. This was proved by the Mann- Whitney U test. These results suggest that specific balance strategy improves balance in the multiple sclerosis patients. The patients even though they showed improvement in their activities of daily living and gait, their gait speed did not show much of an improvement. However they had an efficient gait with reduced frequency of falls. Thus there is a scope for the study to be done on a larger sample size to get a better insight.This is further supported by Kadriye Armutlu, Rana Karabudak, Gulay Nurlu, in their study on multiple sclerosis, concluded that the combination of motor and sensory strategies in balance training is effective in rehabilitation of ataxia in multiple sclerosis 37.
LIMITATIONS OF THE STUDY
- Although the findings were encouraging, the sample size taken was small. Better clinical implications could be possible if further research could establish this further with a larger sample.
- The intervention was shown effective when tested with the berg balance scale, but though the patients demonstrated efficient gait their speed did not show much improvement with the timed up and go test. Further study with a larger sample could help in establishing better results.
RECOMMENDATIONS.
- Patients with multiple sclerosis showed worsening of symptoms especially fatigue in hot and humid climate and post hot water bath. Further scope arises to find out the effect of climate and temperature in their activities of daily living and exercise performance.
- Also further studies with the similar strategy can be done with other types of multiple sclerosis.
CONCLUSION
Results of the study shows that group 2 (experimental group) which received the specific balance strategy & group 1 which received conventional exercise programme have good effect on improving balance in multiple sclerosis patients. But when both the groups were compared, the group which received specific balance strategy gained better improvement in balance than the group received conventional set of exercises
SUMMARY
It was a comparative study where the objective was to compare the effectiveness of specific balance training strategy with conventional balance exercises to improve balance in multiple sclerosis patients. 30 normal individuals were selected randomly from the population and were divided into group 1, conventional and group 2, experimental. Each group consisted of 15 samples.
The subjects were explained about the study procedure. Group 1 received conventional set of balance exercises and group 2 received the specific balance strategy.
Paired and unpaired‘t’ test, Wilcoxon and Mann Whitney test, was used for statistical analysis. Both the groups showed improvement which was statistically highly significant for improvement in the balance. Group 2 which received specific balance strategy showed more improvement than group 1 which received conventional set of exercises.
Therefore the study concludes that specific balance strategy shows significant improvement in balance in patients with multiple sclerosis.
ANNEXURES 1
CONSENT FORM: FOR VOLUNTEERS
I voluntarily accept for the participation in the study entitled “A COMPARATIVE STUDY ON THE EFFECTIVENESS OF SPECIFIC BALANCE STRATEGY VERSUS CONVENTIONAL BALANCE TRAINING TO IMPROVE BALANCE IN MULTIPLE SCLEROSIS PATIENTS- A RANDOMIZED CONTROLLED TRIAL.”
The nature and hazards involved in these studies have been fully explained to me. I understand that I may withdraw from this study at any time.
I consent to the data being collected and stored at the department of physiotherapy and for the data to be used for the research purposes. I understand that I am assured of my anonymity, and that the data will be treated as a confidential document.
I understand that I may also contact the KSHEMA institutional Ethical committee, if I feel I have been unfairly treated.
Date: Signature:
Name:
Witness: Signature: Name:
Investigators statement:
I have carefully explained the nature of the above studies to the subject. Date: Name:
Signature:
ANNEXURE 2
SUBJECT EVALUATION FORM SL No. :
Name: Age: Sex:
Date of assessment:
Referred by:
History: side affected-
Medical history-
Vital signs: respiratory rate- blood pressure- temperature- Examination: Sensory assessment-
Motor assessment- Berg balance scale- Other systems-
Investigation:
Treatment details
Pre test score | Post test score | |
Berg balance scale | ||
Timed up and go test |
Timed, Up, and Go Test (TUG)
The timed “Up & Go” test measures, in seconds, the time taken by an individual to stand up from a standard arm chair (approximate seat height of 46 cm, arm height 65 cm), walk a distance of 3 meters (approximately 10 feet), turn, walk back to the chair, and sit down again. The subject wears his/her regular footwear. If participant’s usually use assistive devices such as canes or walkers, they should use them during the test, but this should be indicated on the data collection form. No physical assistance is given. While setting up the test area, determine a path free from obstruction.
- Place a chair with arms at one end of the path.
- Mark off a 3 m (10 ft.) distance using tape or a cone or other clear marking.
Start the test
- Speak clearly and slowly. Inform participant of sequence and outcome
- “When I say go, you will stand up from the chair, walk to the mark(cone) on the floor, turn around, walk back to the chair and sit down.” “I will be timing you using the stopwatch.” Ask participants to repeat the instructions to make sure they understand.
- Participant starts with their back against the chair, their arms resting on the arm rests, and their walking aid at hand
- Using a cue like “Ready, set, go” might be useful.
- Either a wrist-watch with a second hand or a stop-watch can be used to time the performance.
BERG BALANCE SCALE
Name Date
Location Rater
ITEM DESCRIPTION SCORE (0-4)
- Sitting to standing
- Standing unsupported
- Sitting unsupported
- Standing to sitting
- Transfers
- Standing with eyes closed
- Standing with feet together
- Reaching forward with outstretched arm
- Retrieving object from floor
- Turning to look behind
- Turning 360 degrees
- Placing alternate foot on stool
- Standing with one foot in front
- Standing on one foot
TOTAL
GENERAL INSTRUCTIONS
Please demonstrate each task and/or give instructions as written. When scoring, please record the lowest response category that applies for each item. In most items, the subject is asked to maintain a given position for specific time. Progressively more points are deducted if the time or distance requirements are not met, if the subject’s performance warrants supervision, or if the subject touches an external support or receives assistance from the examiner.
Subjects should understand that they must maintain their balance while attempting the tasks. The choices of which leg to stand on or how far to reach are left to the subject. Poor judgment will adversely influence the performance and the scoring.
Equipment required for testing are a stopwatch or watch with a second hand, and a ruler or other indicator of 2, 5 and 10 inches (5, 12.5 and 25 cm). Chairs used during testing should be of reasonable height. Either a step or a stool (of average step height) may be used for item #12.
- SITTING TO STANDING
INSTRUCTIONS: Please stand up. Try not to use your hands for support. ( ) 4 able to stand without using hands and stabilize independently
( ) 3 able to stand independently using hands
( ) 2 able to stand using hands after several tries ( ) 1 needs minimal aid to stand or to stabilize
( ) 0 needs moderate or maximal assist to stand
- STANDING UNSUPPORTED
INSTRUCTIONS: Please stand for two minutes without holding. ( ) 4 able to stand safely 2 minutes
( ) 3 able to stand 2 minutes with supervision ( ) 2 able to stand 30 seconds unsupported
( ) 1 needs several tries to stand 30 seconds unsupported ( ) 0 unable to stand 30 seconds unassisted
- SITTING WITH BACK UNSUPPORTED BUT FEET SUPPORTED ON FLOOR OR ON A STOOL
INSTRUCTIONS: Please sit with arms folded for 2 minutes. ( ) 4 able to sit safely and securely 2 minutes
( ) 3 able to sit 2 minutes under supervision ( ) 2 able to sit 30 seconds
( ) 1 able to sit 10 seconds
( ) 0 unable to sit without support 10 seconds
- STANDING TO SITTING
INSTRUCTIONS: Please sit down.
( ) 4 sits safely with minimal use of hands ( ) 3 controls descent by using hands
( ) 2 uses back of legs against chair to control descent
( ) 1 sits independently but has uncontrolled descent ( ) 0 needs assistance to sit
- TRANSFERS
INSTRUCTIONS: Arrange chairs(s) for a pivot transfer. Ask subject to transfer one way toward a seat with armrests and one way toward a seat without armrests. You may use two chairs (one with and one without armrests) or a bed and a chair.
( ) 4 able to transfer safely with minor use of hands ( ) 3 able to transfer safely definite need of hands
( ) 2 able to transfer with verbal cueing and/or supervision ( ) 1 needs one person to assist
( ) 0 needs two people to assist or supervise to be safe
- STANDING UNSUPPORTED WITH EYES CLOSED INSTRUCTIONS: Please close your eyes and stand still for 10 seconds. ( ) 4 able to stand 10 seconds safely
( ) 3 able to stand 10 seconds with supervision ( ) 2 able to stand 3 seconds
( ) 1 unable to keep eyes closed 3 seconds but stays steady ( ) 0 needs help to keep from falling
- STANDING UNSUPPORTED WITH FEET TOGETHER
INSTRUCTIONS: Place your feet together and stand without holding.
( ) 4 able to place feet together independently and stand 1 minute safely
( ) 3 able to place feet together independently and stand for 1 minute with supervision ( ) 2 able to place feet together independently and to hold for 30 seconds
( ) 1 needs help to attain position but able to stand 15 seconds feet together
( ) 0 needs help to attain position but unable to stand 15 seconds with feet together.
- REACHING FORWARD WITH OUTSTRETCHED ARM WHILE STANDING
INSTRUCTIONS: Lift arm to 90 degrees. Stretch out your fingers and reach forward as far as you can. (Examiner places a ruler at end of fingertips when arm is at 90 degrees. Fingers should not touch the ruler while reaching forward. The recorded measure is the distance forward that the finger reaches while
the subject is in the most forward lean position. When possible, ask subject to use both arms when reaching to avoid rotation of the trunk.)
( ) 4 can reach forward confidently >25 cm (10 inches) ( ) 3 can reach forward >12.5 cm safely (5 inches)
( ) 2 can reach forward >5 cm safely (2 inches) ( ) 1 reaches forward but needs supervision
( ) 0 loses balance while trying/ requires external support
- PICK UP OBJECT FROM THE FLOOR FROM A STANDING POSITION INSTRUCTIONS: Pick up the shoe/slipper which is placed in front of your feet. ( ) 4 able to pick up slipper safely and easily
( ) 3 able to pick up slipper but needs supervision
( ) 2 unable to pick up but reaches 2-5cm (1-2 inches) from slipper and keep balance independently ( ) 1 unable to pick up and needs supervision while trying
( ) 0 unable to try/needs assist to keep from losing balance or falling
- TURNING TO LOOK BEHIND OVER LEFT AND RIGHT SHOULDERS WHILE STANDING INSTRUCTIONS: Turn to look directly behind you over toward left shoulder. Repeat to the right. Examiner may pick an object to look at directly behind the subject to encourage a better twist turn.
( ) 4 looks behind from both sides and weight shifts well
( ) 3 looks behind one side only other side shows less weight shift ( ) 2 turn sideways only but maintain balance
( ) 1 needs supervision when turning
( ) 0 needs assist to keep from losing balance or falling
- TURN 360 DEGREES
INSTRUCTIONS: Turn completely around in a full circle. Pause. Then turn a full circle in the other direction.
( ) 4 able to turn 360 degrees safely in 4 seconds or less
( ) 3 able to turn 360 degrees safely one side only in 4 seconds or less ( ) 2 able to turn 360 degrees safely but slowly
( ) 1 needs close supervision or verbal cueing ( ) 0 needs assistance while turning
- PLACING ALTERNATE FOOT ON STEP OR STOOL WHILE STANDING UNSUPPORTED
INSTRUCTIONS: Place each foot alternately on the step/stool. Continue until each foot has touched the step/stool four times.
( ) 4 able to stand independently and safely and complete 8 steps in 20 seconds ( ) 3 able to stand independently and complete 8 steps >20 seconds
( ) 2 able to complete 4 steps without aid with supervision ( ) 1 able to complete >2 steps needs minimal assist
( ) 0 needs assistance to keep from falling/unable to try
- STANDING UNSUPPORTED ONE FOOT IN FRONT
INSTRUCTIONS: (DEMONSTRATE TO SUBJECT)
Place one foot directly in front of the other. If you feel that you cannot place your foot directly in front, try to step far enough ahead that the heel of your forward foot is ahead of the toes of the other foot. (To score 3 points, the length of the step should exceed the length of the other foot and the width of the stance should approximate the subject’s normal stride width)
( ) 4 able to place foot tandem independently and hold 30 seconds
( ) 3 able to place foot ahead of other independently and hold 30 seconds ( ) 2 able to take small step independently and hold 30 seconds
( ) 1 needs help to step but can hold 15 seconds ( ) 0 loses balance while stepping or standing
- STANDING ON ONE LEG
INSTRUCTIONS: Stand on one leg as long as you can without holding. ( ) 4 able to lift leg independently and hold >10 seconds
( ) 3 able to lift leg independently and hold 5-10 seconds
( ) 2 able to lift leg independently and hold = or >3 seconds
( ) 1 tries to lift leg unable to hold 3 seconds but remains standing independently ( ) 0 unable to try or needs assist to prevent fall
( ) TOTAL SCORE (Maximum = 56)
REFERENCES
- Susan B O’ Sullivan. Physical rehabilitation assessment and treatment; Multiple sclerosis. 4th edition, pg 715 Jaypee Brothers; 2001.
- Bansil S, Singhal BS, Ahuja GK, Ladiwala U, Behari M, Friede R, Cook SD. Comparison between multiple sclerosis in India and the United States: a case- control study. Journal Neurology 1996 Feb; 46(2):385-87.
- Singhal BS. Multiple sclerosis–Indian experience. Ann Acad Med Singapore.1985 Jan; 14(1):32-6.
- John Walton. Brain’s diseases of the nervous system, Chapter 10. Multiple sclerosis.10th edition, 1993, pg 366, Oxford university press.
- Aronson K, Goldenberg E, Cleghorn G: socio-demographic characteristics and health status of persons with multiple sclerosis and their care givers, MS Management 3(1):5-15, 1996.
- Darcy A Umphred, Debra I, Frenkel. Neurological rehabilitation, chapter 22, multiple sclerosis, 5th edition, 2007, pg 709, Mosby Elsevier publication.
- D Cattaneo, J Jonsdottir, M Zocchi and A Regola LaRice. Effects of balance exercises on people with multiple sclerosis: a pilot study, Clinical Rehabilitation 2007; 21: 771–781.
- Jennifer C Nitz, Nancy Low Choy. “The efficacy of a specific balance strategy training programme for preventing falls among older people: a pilot randomized controlled trail.” Age and aging 2004;33:52-58.DOI:10.1093/ageing/afh028.
- Cameron MH, Horak FB, Herndon RR, and Bourdette D. “Imbalance in multiple sclerosis: a result of slowed spinal somatosensory conduction.”J Neurol 2008 mar; 255 suppl 1:75-83.PMID18570015
- Kesselring J, Beer S “Symptomatic therapy and neurorehabilitation in multiple sclerosis”Lancet neurology 2005: 4(10):643-52.PMID 16168933
- Woorlacott MA. “Systems contributing to balance disorders in older adults.” J Gerontol Med Sci 2000; 55A:M424-8.
- Frzovic D, Morris ME, and Vowels L. “Clinical tests of standing balance: performance of persons with multiple sclerosis.” Arch phys med rehabil 2000; 81:215-21.
- Williams NP, Roland PS, Yellin W. “Vestibular evaluation in patients with early multiple sclerosis.”Am J otol 1997; 18:93-100?
- Daley ML, Swank RL. “Quantitative posturography use in multiple sclerosis.”IEEE trans biomed eng 1981;28:668-71
- Cattaneo D,DL Nuzzo C, Fascia T, Macalli M, Pisoni I, Cardini R. “Risks of falls in subjects with multiple sclerosis.”Arch phys med rehabil 2002; 83:864-67.
- Joel A DeLisa, James A Sliwa and Bruce A Cohen. Rehabilitation medicine Principles and Practice. Multiple sclerosis, chap 50, pg 1241, 3rd edition, Lippincott Raven.
- McDonald WI, Compston A, Edan G, et al. “Recommended diagnostic criteria for multiple sclerosis: guidelines from the International Panel on the diagnosis of multiple sclerosis”. Ann. Neurol. July 2001; 50 (1): 121–7. PMID 11456302.
- Rosati G. “The prevalence of multiple sclerosis in the world: an update”. Neurol.
Sci. April 2001; 22 (2): 117–39. PMID 11603614.
- Kenneth n Anderson and Lois E Anderson. Mosby’s Pocket Dictionary of Medicine and Allied Health., 1st edition, 1993
- Compston DA: Mc alpine’s Multiple Sclerosis, 3rd edition, 1998, Churchill Livingstone.
- Zaffaroni M, Ghezzi A: the prognostic value of age, gender, pregnancy and endocrine factors in multiple sclerosis. Neurol sci 21:s857-s860, 2000.
- Paty DW, Ebers GC: Multiple sclerosis, Philadelphia, 1998.
- Kraft GH, Freal JE, Coreyll JK, et al: ms: early prognostic guidelines, arch phys med rehabil 62(2):54-58, 1981.
- Davis, F. A., Bergen, D., Schauf, C., et al movement phosphenes in optic neuritis: a new clinical sign. J Neurology July 1976, 26, 1100.
- Honan, W. P., Heron, J. R., Foster, D. H and Snelgar R S. Paradoxical effects of temperature in MS. J neurol neurosurg.psychiat. 1987, 50, 1160.
- Freeman JA, et al. Outcome measures to quantify the effects of physical therapy for people with multiple sclerosis. Neurology Report 2002, 26(3):139–144.
- Stolp-Smith, K. Et al: Management of impairment, disability, due to multiple sclerosis mayo clinic proc 72:1184, 1997.
- Kasser, Susan L, Rose, Debra J, Clark, Sean. Balance training for adults with multiple sclerosis: Multiple case studies. Neurology Report, Mar 1999.
- Soyuer F, Mirza M, Erkorkmaz U. Balance performance in three forms of multiple sclerosis. Neurol Res. 2006 Jul; 28(5):555-62.
- Smedal T, Lygren H, Myhr KM, Moe-Nilssen R, Gjelsvik B, Gjelsvik O, Strand LI. Balance and gait improved in patients with MS after physiotherapy based on the Bobath concept. Physiother Res Int. 2007 Mar; 12(1):52.
- Fulk GD. Locomotor training and virtual reality-based balance training for an individual with multiple sclerosis: a case report. J Neurol Phys Ther. 2005 Mar; 29(1):34-42.
- Steinberg M, Cartwright C, Peel N, Williams G. A sustainable programme to prevent falls and near falls in community dwelling older people: results of a randomised trial. J Epidemiol Commun Health 2002; 54: 227–32.
- Allen A, Simpson JM. A primary care based fall prevention programme.
Physiother theory Practice 1999; 15: 121–33.
- DeBolt L., & Mc Cubbin, J. (2004). The effects of home-based resistance exercise on balance, power, and mobility in adults with Multiple Sclerosis. Arch Phys Med Rehabil, 85, 290-297.
- Romberg A, Virtanen A, Ruutiainen J et al. “Effects of a 6 month exercise program on patients with multiple sclerosis: a randomized controlled study.” Neurology 2004; 63:2034-38.
- S E Lord, D T Wade, P W Halligan. A comparison of two physiotherapy treatment approaches to improve walking in multiple sclerosis: a pilot randomized controlled study. Clinical Rehabilitation, Vol. 12, No. 6, 477-486 (1998)
- Kadriye Armutlu Rana Karabudak Gülay Nurlu. Physiotherapy Approaches in the Treatment of Ataxic Multiple Sclerosis: A Pilot Study. Neurorehabilitation and Neural Repair, Vol. 15, No. 3, 203-211 (2001)DOI: 10.1177/154596830101500308.
- White LJ, Dressendorfer RH, Exercise and Multiple sclerosis, sports med 2004;34(15):1077-100.
- Cattaneo D, Jonsdottir J, Repetti S. Reliability of four scales on balance disorders in persons with multiple sclerosis, Disabil rehab. 2007 dec30; 29(24):1920-5. Epub 2007 Apr26.
- Riddle DL, Stratford PW. Interpreting validity indexes for diagnostic tests: an illustration using the Berg balance test. Phys Ther 1999; 79: 939–48.
- Cattaneo D, Regola A, Meotti M. Validity of six balance disorders scales in persons with multiple sclerosis. Disabil rehabil 2006 jun30; 28(12):789-95.
- Podsiadlo D, Richardson S. The timed ‘up and go’: a test of basic functional mobility for frail elderly persons. J Am Geriatr Soc 1991; 39: 142–8.
- Martin CL, Phillips BA, Kilpatrick TJ, Butzkueven H, Tubridy N, McDonald E, Galea MP. Gait and balance impairment in early multiple sclerosis in the absence of clinical disability. Mult sclera 2006 Oct; 12(5):620-8.
Factors influencing the implementation of Evidence-Based Practice among Indonesian Physiotherapists in Jakarta and the surrounding area, Indonesia
Authors
1. Septian Arief Gandaputra
Physiotherapy Program, Padma Kumara –SGT Indonesia , Indonesia
Email: asnov.fisioterapi@gmail.com
2. Imam Waluyo
Senior Researcher of Wellness , Traditional Complemenatry Medicine
Padma Kumara –SGT Indonesia
Email: scientist.com_antoniwa@mail.com
3. Ho-Jui Tung
Faculty of Health Sciences, Asia University, Taiwan
Email: htung@asia.edu.tw
4. Ferry Efendi
Faculty of Nursing, Universitas Airlangga, Indonesia
Email: ferry-e@fkp.unair.ac.id
5. Hery Prambudi, An Nasher Institue of Health Sciences Cirebon Indonesia
Email : heryprambudi21@gmail.com
Abstract
Objective: The study aimed to explore the profile of evidence-practice implementation and its associated factors among Indonesian Physiotherapists in Jakarta and the surrounding area, Indonesia.
Methods: This study was a cross-sectional design. Proportional sampling technique used to determine the sample as a representative of the population. Twenty-one public and private hospitals and around 104 full-time registered Physiotherapists participated in this study. The study adopted the instruments which have been established to investigate the attitude of Physiotherapists towards Evidence-Based Practice which developed by Jette (2013). Univariate analysis and logistic regression were employed to see if there are significant relationships between the predictors and outcome.
Results: More than half of participants were less than 40 years old (61.5%). Participants have been recognized as having worked in the field of physiotherapy with duration of fewer than ten years (43.3%). For educational background, the participants who certified as Bachelor of Applied Science (B.Sc.) was 21.2%. The results revealed the association between predictors and EBP implementation. Physiotherapists who were admitted that they were doing self-learning in seeking information and other additional more likely to have a positive attitude towards EBP (OR=1.472). Similarly, working as physiotherapy for more years positively associated with EBP implementation (OR = 1.009)
Conclusion: In general, self-intention to develop their skill and their knowledge on EBP and also the duration of working as physiotherapists were contributed to influence the attitude of physiotherapists toward Evidence-Based Practice. In future studies, the understanding level of EBP terms should be distinguished. Hence, it could differentiate the physiotherapists from the low-level to the high-level according to their understanding of EBP.
Keywords: evidence-based, implementation, associated factors, Physiotherapy, Indonesia.
Background
Evidence-based practice (EBP) is needed to improve the quality of patient care in daily practice especially in physiotherapy healthcare services [1]. Physiotherapist as professional health practitioners is obliged to provide excellent health services, which are based on the best research evidence in clinical decision making [2]. Further, clinical decision making in the physiotherapy field is central to the autonomy of professional practice. Therefore, this process and skills in critical thinking and problem-solving use to determine decisions and actions that are appropriate in handling patients effectively [3],[4],[5]. EBP itself combines attention, interest, cognition and psychomotor aspects to make decisions about diagnosis, intervention, and to provide an explanation to the patient about the description of the disease [6],[7].
Several studies have been conducted regarding professional ability that has mainly focused on physiotherapy professionalism aspects such as self-development, organizational support and other individual factors related to the practice of evidence in order to enhance patient satisfaction and to undertake ethical decision-making in health services [8],[9],[10],[11],[12]. Among the regions in South Asia, the previous research has been conducted in the Philippines and Malaysia [13],[14]. In Indonesia, lack of sufficient studies that reporting the positive attitude towards EBP and the influencing factors could be more interesting to discuss. Therefore, a more in-depth study of matters related to the implementation of EBP among Indonesian physiotherapist is needed. The primary purpose of this study consists of two main parts. First, describing the physiotherapist’s profile related to EBP implementation such as individual characteristics, self-development, and organizational support. Second, to investigate the factors that influence Physiotherapist’s decision on implementing evidence-based as a health professional in day-to-day work.
Methods
This study was a cross-sectional study conducted in both public and private health services located in the Jakarta and the surrounding area, Indonesia. The determination of the minimum sample has been framed from a guideline from RISFASKES (national research on health facilities) by the Jakarta region. The proportional sampling technique was employed to calculate the number of participants. Around 21 physiotherapy units had been authorized to be set as the subject in this study. There were either public (6 units) or private (15 units) involved, and all selected physiotherapists were recruited as subjects of this study. To measure the physiotherapist’s attitude towards EBP, we referred to the validated instrument established by Chimdi [4]. The instrument was adopted and modified to fulfill the study requirement. The instrument consisted of some sub-topics which are described as the following variables such as socio-demographic, organizational support, and Physiotherapy’s self-learning towards the source of information they need in order to develop a sound clinical decision making, and the role of the organizational support to set them free to enhance their both soft and hard skill in Physiotherapy. Univariate analysis and logistic regression were employed to determine the correlation where associations were found.
Results
The univariate analysis presents the distribution of participant characteristics as shown in table 1. The participants in this study were generally less than 40 years old (61.5%). Participants have been recognized as having worked in the field of physiotherapy with duration of fewer than ten years (43.3%). For educational background, most of the participants were certified as diplomas (78.8%), while those who had undergraduate science certificates (21.2%). The results of this study have classified participants into two types based on institutional status. Those who work in private institutions (55.8%) are slightly larger than government institutions (29.8%). Around 60.6% of participants felt that they had been supported by the conditions they worked to improve their skills and knowledge related to clinical decision making to the needs of patients. Physiotherapists who have started themselves to find related information to support their clinical skills in clinical practice is calculated at around 22.1%.
Table 1. Characteristics of participants
Variables | Percent Distribution N = 104 | |
(%) | ( n ) | |
Physiotherapists age | ||
Less than 40 years old | 61.5 | 64 |
Above 41 years old | 38.45 | 40 |
Working duration as physiotherapist | ||
Less than 10 years | 43.3 | 45 |
More than 11 years | 56.7 | 59 |
The Last degree in physiotherapy | ||
Diploma | 78.8 | 82 |
Bachelor of science | 21.2 | 22 |
Type of institution the physiotherapist work | ||
Public | 29.8 | 31 |
Private | 55.8 | 58 |
Perceived organizational support | ||
Fully supported | 60.6 | 63 |
Lack of support | 39.4 | 41 |
Self-learning / self-development in clinical information sources | ||
Frequently | 77.9 | 81 |
Seldom | 22.1 | 23 |
Table 2 Analysis of logistic regression between associated factors EBP implementation
Variables | B | OR | P value | 95% CI | ||
lower | upper | |||||
Age | ||||||
Less than 40 yearsa | 1.18 | 3.26 | 0.07 | 0.90 | 11.83 | |
The current physiotherapy education | ||||||
Bachelor of applied science a | 0.80 | 2.23 | 0.18 | 0.70 | 7.15 | |
Working duration | ||||||
More than 10 years | 1.39 | 3.81 | 0.04* | 1.10 | 13.21 | |
Self-learning / self-development in utilizing information sources | ||||||
Frequentlya | 1.49 | 4.46 | 0.01* | 1.47 | 13.52 | |
Perceived organizational support | ||||||
Fully supporteda | 0.14 | 1.16 | 0.78 | 0.41 | 3.27 | |
a = reference category *Significant value P < 0.005 | ||||||
Discussion
This study investigated the profile and the factors associated with EBP implementation among the Physiotherapist in Jakarta and its surrounding area. According to the results, this study failed to find a significant relationship between young age and evidence-based practice behavior in day-to-day work. This thing is contrary to the previous research which found that young age determines individuals to develop themselves in terms of learning towards EBP. Young age predicts the intention to learn from a sense of self-fulfillment in broadening their self-capacities [14]. Physiotherapy with Bachelor of applied science (B.Sc.) degree has been set to predict Physiotherapist’s decision to EBP in a positive direction. However, the results of the logistical analysis of this study did not find an association between the study level of the B.Sc. degree and the tendency to make evidence-based decisions. Contrarily, several studies a study found that the higher educational level demands the development of concepts and knowledge [15, 16]. It has an essential role in providing provision to physiotherapists to think logically and systematically based on recent evidence. Hence, it could bring the basis of thinking to fulfill the patient’s needs through the effective and efficiency of treatments.
In the context of the working duration as a physiotherapist, there was a significant relationship shown against the behavior of applying evidence base. The experience of working as a physiotherapist determines the behavior of Physiotherapy which this study shows the Physiotherapist tend to behave well in evidence-based implementation. This phenomenon also indicated by a study conducted by Gerrish which stated that working senior physiotherapist will make a major contribution to clinical decision making based on scientific and current sources.
The self-development factor towards scientific knowledge and scientific data based has a significant role in EBP. In this study, physiotherapists who have the intention to continue to update science and the latest data have a substantial role in changing normal behavior towards evidence-based. The previous studies confirmed that the intention and motivation in self-development played a significant role in increasing the ability to find sources of evidence to support the creation of effective and safe services for patients [2], [17], [18].
The study has indicated some limitations during the survey. First, the term Evidence-Based Practice may not commonly and adequately be understood by Physiotherapists in this study, either about the terminology itself or the definition. This matter could be caused by the ambiguity in terms of explanation during the survey. To some extent, these factors can affect the research subject when they are filling out the questionnaire although the study has been arranged the concept from recent journals. However, the concept of this study still considered as incomplete and debatable factors. In the next future, there are other multifactor should be involved concerning the Physiotherapist’s decision in the implementation of EBP such as the circumstances of the system, culture, history, regulation, and policy related to self-development and decision-making authority [13].
Conclusion
In general, this study found that self-learning and working duration were considered to be predictors toward attitude in EBP. Future studies are needed to assess the interconnections and relationships between and around the proficiency of seeking relevant scientific evidence on their professional performances. Other specific topics would be related to the environmental support, and other determinants such as the physiotherapist’s workplace needs, the management system in place, current policies and the regulations regarding the physiotherapist’s professional and self-development focused on clinical reasoning. Evidence-based practice is still quite complex to understand and need more specific training or certification on EBP.
Conflicts of interest
Nnone of the authors of this study has a conflict of interest in any way.
Funding/support
There is no funding added to this study.
Authors’ contributions
- Septian Arief Gandaputra proposed the original idea, conducted the statistical analyse, and drafted the manuscript
- Mr. Imam Waluyo gave us valuable feedbacks and critiques in preparing and revising the manuscrip especially in the content and conceptual framework.
- Dr. Ho-Jui Tung refined redirected the data analyses, and assisted to draft the manuscript.
- Ferry Efendi supervised all the contextual concept and also give his hand on proof-reading proces, particulary for academic writing
Ethical Clearance
The ethical clearance was obtained for the research project. The journal has the right to ask for a copy of ethical clearance.
Acknowledgement
We would like to thank to the contributors to this research such as co-authors who give valuable work for this research, team project of the study and also the participants who took part in the study.
References
[1]. Jette, D.U., et al., Evidence-based practice: beliefs, attitudes, knowledge, and behaviors of physical therapists. Physical therapy, 2003. 83(9): p. 786-805.
[2]. Bridges, P.H., L.L. Bierema, and T. Valentine, The propensity to adopt evidence-based practice among physical therapists. BMC health services research, 2007. 7(1): p. 103.
[3]. Herbert, R., et al., Practical Evidence-Based Physiotherapy-E-Book. 2011: Elsevier Health Sciences.
[4]. Cimdi, C., Evidence-based practice (EBP) in rehabilitative physiotherapy. Internet Journal of Allied Health Sciences and Practice, 2012. 10(4): p. 10.
[5]. Sackett, D.L., et al., Evidence based medicine: what it is and what it isn’t. 1996, British Medical Journal Publishing Group.
[6]. Akobeng, A., Evidence in practice. Archives of disease in childhood, 2005. 90(8): p. 849-852.
[7]. Wainwright, S.F., et al., Factors that influence the clinical decision making of novice and experienced physical therapists. Physical Therapy, 2011. 91(1): p. 87-101.
[8]. Chidozie, E., O. Adetutu, and A. Udoka, Effects of a Customized Professionalism Educational Intervention on Physical Therapists’ Knowledge and Attributes of Professionalism. Internet Journal of Allied Health Sciences and Practice, 2018. 16(2): p. 9.
[9]. Bello, A.I. and I.G. Lawson, Attitudes and barriers towards engaging in continuing professional development among clinical physiotherapists in Ghana. Internet Journal of Allied Health Sciences and Practice, 2013. 11(1): p. 7.
[10]. Bury, T.J. and E.K. Stokes, A global view of direct access and patient self-referral to physical therapy: implications for the profession. Physical therapy, 2013. 93(4): p. 449-459.
[11]. da Silva, T.M., et al., What do physical therapists think about evidence-based practice? A systematic review. Manual therapy, 2015. 20(3): p. 388-401.
[12]. Condon, C., et al., Ability of physiotherapists to undertake evidence-based practice steps: a scoping review. Physiotherapy, 2016. 102(1): p. 10-19.
[13]. Dizon, J.M.R., K. Grimmer-Somers, and S. Kumar, The physical therapy profile questionnaire (PTPQ): development, validation and pilot testing. BMC research notes, 2011. 4(1): p. 362.
[14]. Yahui, H.C. and N. Swaminathan, Knowledge, attitudes, and barriers towards evidence-based practice among physiotherapists in Malaysia. Hong Kong Physiotherapy Journal, 2017. 37: p. 10-18.
[15]. Stevenson, K., M. Lewis, and E. Hay, Do physiotherapists’ attitudes towards evidence‐based practice change as a result of an evidence‐based educational programme? Journal of Evaluation in Clinical practice, 2004. 10(2): p. 207-217.
[16]. Brown, C.E., et al., Nursing practice, knowledge, attitudes and perceived barriers to evidence‐based practice at an academic medical center. Journal of advanced nursing, 2009. 65(2): p. 371-381.
[17]. Paterson, C. and J. Chapman, Enhancing skills of critical reflection to evidence learning in professional practice. Physical Therapy in Sport, 2013. 14(3): p. 133-138.
[18]. French, H. and J. Dowds, An overview of continuing professional development in physiotherapy. Physiotherapy, 2008. 94(3): p. 190-197.
A COMPARATIVE STUDY BETWEEN MANUAL THERAPY AND CONVENTIONAL THERAPY IN CASE OF PLANTAR FASCIITIS
Mukesh Kumar Goyal
Dean (Faculty of Medical Para-Medical And Allied Health Sciences)
Tantia University, Sri Ganganagar (Rajasthan) 335001 India
INTRODUCTION
Plantar fasciitis is a non-inflammatory degenerative syndrome of the plantar fascia resulting from repeated trauma at its origin on the calcaneus.1 To date, there is evidence that this condition may not be characterized by inflammation but, rather by non-inflammatory degenerative changes in the plantar fascia.2
Plantar fasciitis is the most common cause of heel pain3,4. It has been estimated that it affects as much as 10% of the general population over the course of a lifetime.5 The condition is bilateral in up to one-third of cases. Incidence reportedly peaks in people between the age of 40 to 60 years in general population.6 The condition is thought to be multi-factorial in origin with factors such as obesity, decreased ankle joint range of motion, prolonged weight bearing and increase in age are suggested to be commonly involved7,8. Buchbinder et al6 in his study observed that risk of plantar fasciitis increases as the range of ankle dorsiflexion decreases. Individuals with less than 100 of ankle dorsiflexion had an odds ratio of at least 2:1 for plantar fasciitis and the ratio increased dramatically as the range of dorsiflexion decreased.5 Patients typically report an insidious onset of pain which is usually burning, stabbing, dull- aching or sharp in nature and is localized under the plantar surface of the heel.9 It is commonly experienced upon weight bearing after a period of rest. This pain is most noticeable in morning with the first few step and is often described as ‘first-step pain’.10 In some cases, the pain is so severe that it results in an antalgic gait. However it lessens with increased activity but tends to worsen towards the end of the day or prolonged weight-bearing. Patient usually reveals a history of barefoot standing/walking or jobs which require prolonged weight-bearing.11 Sometimes recent history of increased activity or even sudden weight gain is also present.
Plantar fasciitis is considered as a self limiting condition. However the typical resolution time is anywhere from 6-18 months or sometimes longer.12 Conservative management is reportedly very successful.6,12,13 Cryotherapy, therapeutic ultrasound with or without phonophoresis, electrical stimulation, whirlpool and administration of NSAID through iontophoresis are said to be effective.14,15 Recently published clinical practice guidelines reported that although weak, but there are evidences which support that manual therapy is effective in the management of heel pain.16
METHODOLOGY
The study design was experimental study and different subject design. It was conducted in the Out-patient Department of Physiotherapy, Sri Aurobindo Institute of Medical Sciences, Indore. 30 subjects who fulfilled the inclusion and exclusion criteria were equally divided into two groups by random sampling method. The total duration of study was 3 weeks. An informed consent was taken from each subject prior to participation. Then they were evaluated for pain and disability using Numeric Pain Rating Scale (NPRS) and Foot Function Index (FFI) before and at the end of the study. Foot Function Index (FFI): It is a self-report questionnaire with three subscales f or pain, disability and activity-limitation. This scale consist a total of 23 questions. High scores indicate greater disability or decreased function. The test-retest reliability of FFI total and sub-scale scores is 0.87-0.69.17
Numeric Pain Rating Scale (NPRS): An 11-point NPRS (0, no pain; 10, worst imaginable pain) was used to measure pain intensity. Numeric pain scales have been shown to be reliable and valid.18,19, 20
Inclusion Criteria:
- Age group 40-55 years
- Both sex groups
- Experienced symptoms for at least 4 weeks or more
- NPRS score of more than or equal to 4
Exclusion Criteria:
- Radiological evidence showing calcaneal spur
- Any acute inflammation in ankle-foot region
- Red flags to manual therapy (i.e. tumor, fracture, osteoporosis)
- Prior surgery to distal tibia, fibula, ankle joint or rear foot region
- Prior physiotherapy treatment
Group A (Conventional therapy): Subjects were treated with
- Ultrasound with an output of 1.5 w/cm2 for 7 minutes using a continuous mode with a frequency of 3 MHz.
- Stretching : calf muscles
- Stretching : plantar fascia
-
Strengthening exercises for intrinsic foot muscles:
- Standing toe curls
- Towel toe curls
- Ice pack for 10 minutes.
Group B (Manual therapy): Subjects were treated with
-
Mobilization : Ankle-foot complex
- Talocrural joint posterior glides
- Subtalar joint lateral glides
- Subtalar joint distraction manipulations
- 1st Tarsometatarsal joint Ant/Post glides
- Stretching : calf muscles
- Stretching : plantar fascia
- Strengthening exercises for intrinsic foot muscles:
Patients of both groups were instructed to follow a home-exercise program including strengthening exercises for intrinsic foot muscles and self- stretching of plantar fascia and calf muscles. They were also advised to use soft-heel footwear, avoid prolonged standing, walking barefoot and not to take any other treatment or medications.
RESULTS AND TABLES
The dependent variables were NPRS and FFI. Pre- treatment scores for pain and disability were recorded on the first day. Then treatment was given to both groups and their post-treatment scores were recorded on the last day.
Unpaired t-test was used to examine changes in the dependent variables.
p-value < 0.05 is taken up for statistical Mean ± SD for disability at pre-treatment was 41.01 ± 5.85 and 42.67 ± 5.90 for group A and group B respectively and ‘t’ calculated value was 0.77 at n + n -2 degree of freedom. Data analysis demonstrated no statistically significant difference between the two groups.
1 2
Whereas, mean ± SD for disability at post- treatment was 6.20 ± 1.96 and 4.16 ± 2.20 for group A and group B respectively and ‘t ’ calculated value was 2.68 at n + n -2 degree of freedom. Data analysis demonstrated statistically significant difference between the two groups.
1 2
DISCUSSION
The results of the present study showed that manual therapy is more effective in improving pain and disability in patients with plantar significance at n + n-2 degree of freedom fasciitis. This is in accordance with the previous studies done by Cleland JA et al 21 and Young B
Table 1: Pre and Post treatment comparison of both the groups in terms of pain (NPRS).
Parameters | Pre | Post | ||
Group A | Group B | Group A | Group B | |
Mean ± SD | 6.53±1.68 | 6.80±1.68 | 2.27±1.53 | 1.00±1.07 |
p value | 0.62 | 0.01 | ||
t value | 0.5 | 2.62 | ||
Mean ± SD for pain at pre-treatment was 6.53 ±
1.68 and 6.80 ± 1.68 for group A and group B respectively and ‘t’ calculated value was 0.50 et al22 who support the use of manual physical therapy as superior approach in the management of plantar heel pain. Young B et al concluded in his study that patients of heel pain who were managed with manual physical therapy reported clinically meaningful reduction in pain and dysfunction.22
In plantar fasciitis, the fascia undergoes degeneration and becomes tight thereby leading to hypomobility within the ankle-foot complex, especially talocrural, subtalar and 1st tarsometatarsal joints. Limitation of talocrural at n+n-2 degree of freedom. Data analysis joint dorsiflexion, would require compensatory demonstrated no statistically significant difference between the two groups.
Whereas, mean ± SD for pain at post-treatment was 2.27 ± 1.53 and 1.00 ± 1.07 for group A and group B respectively and ‘t’ calculated value was movements at more distal joints to allow forward progression of leg over the foot during stance phase of the gait. This could theoretically decrease the height of medial longitudinal arch, therefore potentially increase tensile stress 2.62 at n+n-2 degree of freedom. Data through the plantar fascia. Although talus has analysis demonstrated statistically significant difference between the two groups.
1
2
Table 2: Pre and Post treatment comparison between both the groups in terms of disability (FFI).
Parameters | Pre | Post | ||
Group A | Group B | Group A | Group B | |
Mean ± SD | 41.01±5.85 | 42.67±5.90 | 6.20±1.96 | 4.16±2.20 |
p value | 0.49 | 0.01 | ||
t value | 0.77 | 2.68 | ||
No direct muscle attachments, many muscles cross the talus and can influence the mechanics of talocrural, subtalar and 1st TMT joint. Both triceps surae and plantar fascia attach to the calcaneus and cross these joints. Likewise capsular restrictions in the talocrural and subtalar joint may also affect talar mechanics and have an influence on ankle dorsiflexion. Thus it is assumed that improvement in Talocrural, 1st TMT and subtalar joint mobility may contribute to normal joint mechanics and pain-free movement.
It has been argued that manipulative procedures play a major part in regaining the range of movement or function of the joint. 23 Lantz contends that ‘the importance of passive mobilisation and manipulation lies in the restoration of gross movements and accessory movements, which cannot be gained by patients through exercises alone, and certainly not by rest.’ The biomechanical basis of foot manipulation as outlined by Mennell predominantly focuses on the use of Foot Mobilisation Techniques to improve range of motion in hypomobile joints.24 This approach is also favoured by Michaud.25
Strengthening plays an important role in the treatment of plantar fasciitis and correct functional risk factors such as weakness of intrinsic foot muscles. Plantar fasciitis is often attributable to poor intrinsic muscles strength and poor force attenuation. Boyd HS et al (1992) in his study found that strengthening exercises for intrinsic foot muscles were cited as one of the most helpful treatment in heel pain. Strong intrinsic muscles thereby help in supporting the arches of the foot.
Digiovanni BF et al supported the use of plantar fascia specific stretching as a key component of treatment for plantar fasciitis. 26
Stretching reduces the tension in the fascia, which becomes tight during plantar faciitis. Thereby it recreates the windlass mechanism27 by optimizing the tissue tension. Thus, it allows the toes to dorsiflex, the calcaneus to rotate inwards (into varus) and the medial arch to elevate properly, in the later part of the stance phase.
Michelsson O et al28 concluded that, calf stretching is effective in improving function in plantar fasciitis and should be one of the treatments incorporated into the management program for patients with plantar fasciitis.
The rationale behind using calf stretching in plantar fasciitis is to improve dorsiflexion range of motion and thereby releasing the stress on plantar fascia during push-off phase of gait cycle.
Limitations of the study
- The study was done on a small sample size
- Study was conducted over a short period of time
- No follow-up could be done to see the long term effects
CONCLUSION
Thus, the present study concludes that manual therapy approach is superior to conventional therapy in improving pain and disability, in individuals with plantar fasciitis.
ACKNOWLEDGEMENT: None
CONFLICT OF INTEREST: There is no conflict of interest with any financial or business organization regarding the material discussed in this manuscript.
SOURCE OF FUNDING: Self-funding
ETHICAL CLEARANCE: We certify that this study involving human subjects is in accordance with Helsinki declaration of 1975 and has been approved by the relevant ethical committee.
REFERENCES
- Kwong PK, Kay D, Voner PT, White MV. Plantar fasciitis: mechanics and pathomechanics of treatment. Clin Sports Med. 1988; 7(1): 119-26.
- Lemont H, Ammirati KM, Usen N. PF: a degenerative process (fasciosis) without inflammation. J Am Podiatr Med Assoc. 2003; 93: 234-37.
- Hammer, W. Soft tissue examination and treatment methods, p. 590, 1999.
- Greenfield, B. Evaluation of overuse syndromes. The Biomechanics of the Foot and Ankle, 1990.
- Riddle DL, Pulisic M, Pidcoe P, Johnson RE. Risk factors for plantar fasciitis: a matched case-control study. J Bone Joint Surg Am. 2003; 85–A: 872-77.
- Buchbinder R. Clinical practice. Plantar fasciitis. N Engl J Med. 2004; 350: 2159-66.
- DB Irwing, Cook JL, Menz HB. Factors associated with chronic plantar heel pain: A systematic review. J Science and Med in Sports. 2006 May, vol 9, issue 1-2: 11-12.
- JA Radford, Karl B Landrof, Rachelle Buchbinder, Catherine Cook. Effectiveness of low-dye taping for the short-term treatment of plantar heel pain. A randomized trial. BMC Musculoskel. Disorder. 2006; 7: 64.
- Alvarez Nemegyei J,Canoso JJ. Heel pain: diagnosis and treatment, step by step. Cleve Clin J Med. 2006; 73: 465-71.
- Barrett SJ, O’Malley R. Plantar fasciitis and other causes of heel pain. Am Fam Physician. 1999; 59: 2200-06.
- Cole C, Seto C, Gazewood J. Plantar fasciitis: evidence based review of diagnosis and therapy. Am Fam Physician. 2005; 72: 2237-42.
- Young CC, Rutherford DS, Niedfeldt MW. Treatment of plantar fasciitis. Am Fam Physcian. 2001; 63: 467-74, 477-78.Dishan Singh, John Angel, George Bentey, Saual G Trevino. Fortnightly review: Plantar fasciitis. BMJ. 1997; 315: 172-75.
- Gudeman SD, Eisele SA, Heidt RS jr.,Colosimo AJ, Stroupe AL. Treatment of plantar fasciitis by iontophoresis of 0.4% dexamethasone. A randomized double blind, placebo-controlled study. Am J Sports Med. 1997; 25: 312-16.
- Osborne HR, Allison GT. Treatment of plantar fasciitis by low-dye taping and iontophoresis: short-term results of a double blinded, randomized, placebo-controlled clinical trial of dexamethasone and acetic acid. Br J Sports Med. 2006; 40: 545-49.
- McPoil TG, Martin RL, Cornwall MW, Wukich DK, Irrgang JJ, Godges JJ. Heel pain- Plantar fasciitis: clinical practice guidelines linked to the international classification of function, disability and health from the orthopaedic section of the American physical therapy association. J Orthop Sports Phys Ther. 2008; 38: A1-A18.
- Budiman-Mak E., Conrad, K. J., & Roach, K. E. (1991). The Foot Function Index: a measure of foot pain and disability. J Clin Epidemiol, 44(6) : 561-70.
- Downie WW, Leatham PA, Rhind VM, Wright V, Branco JA, Anderson JA. Studies with pain rating scales. Ann Rheum Dis. 1978; 37: 378-81.
- Farrar JT, Young JP, Jr., LaMoreaux L, Werth JL, Poole RM. Clinical importance of changes in chronic pain intensity measured on an 11-point numerical pain rating scale. Pain. 2001; 94: 149-58.
- Price DD, Bush FM, Long S, Harkins SW.A comparison of pain measurement characteris-tics of mechanical visual analogue and simple numerical rating scales. Pain. 1994; 56: 217-26.
- Cleland JA, Abbott JH, Kidd MO, Stockwell S, Cheney S, Gerrard DF, Flynn TW. Manual physical therapy and exercise versus electrophysical agents and exercise in the management of plantar heel pain: A multicenter randomized clinical trial. J Orthop Sports Phys Ther. 2009; 39(8): 573-85.
- Young B, Walker MJ, Strunce J, Boyles R. A combined treatment approach emphasizing impairment- based manual physical therapy for plantar heel pain: A case series. J Orthop Sports Phys Ther. 2004; 34: 725-33.
- Lantz CA. A critical look at the subluxation hypothesis. J Manipulative Physiol Ther 1989 Apr; 12(2): 152-55.
- Mennell JM. Rationale of joint manipulation. Phys Ther 1970 Feb; 50(2): 181-86
- Michaud TC. Foot Orthoses and Other Forms of Conservative Foot Care. Baltimore: Williams and Wilkins, 1993.
- DiGiovanni BF, Nawoczenski DA, Lintal ME el al. Tissue specific plantar fascia stretching exercise enhances outcomes in patients with chronic heel pain. A prospective, randomized study. J Bone Joint Surg Am. 2003; 85-A: 1270-77.
- Hicks JH. The mechanism of the foot. The plantar aponeurosis and the arch. J Anat. 1954; 88: 25-30.
- Michelsson O, Konttinen YT, Paavolainen P, Santavirta S. Plantar heel pain and its 3-mode 4- stage treatment. Mod Rheumatol. 2005; 15: 307
BIOMECHANICS IN PATELLOFEMORAL PAIN SYNDROME
Dr Muskan Rathor
Lecturer (Faculty of Medical Para-Medical And Allied Health Sciences)
Tantia University, Sri Ganganagar (Rajasthan) 335001 India
AN OVERVIEW
Patellofemoral pain syndrome (PFPS) is one of the most common knee joint problems in musculoskeletal disorders presenting to outpatient clinics. Patellofemoral pain syndrome can be defined as retro-patellar or peri-patellar pain, aggravated by climbing stairs, running, squatting, cycling and long sitting with flexed knees for prolonged periods of time. The incidence of ‘‘anterior knee pain’’ is high and is located at 22/1,000 persons per year. Women are affected about more than twice as often as men, the causes for anterior knee pain are multifactorial.These include overuse injuries of the extensor apparatus (tendonitis, insertionaltendinosis), patellar instability, chondral and osteochondral damage. The patellofemoral pain syndrome (PFPS) is a common cause for ‘‘anterior knee pain’’ and mainly affects young women without any structural changes such as increased Q-angle or significant pathological changes in articular cartilage. Other associated manifestations include crepitus and functional deficit. PFPS symptoms cause many athletes to limit their sportive activities. According to some authors, the PFPS can eventually lead to osteoarthritis.The long-term prognosis is generally more favorable for young patients, but seems to be independent of the presence of cartilage damage or gender.Patients with PFPS might repeatedly visit physicians and physiotherapists to solve their problem. About 94% of these patients continue to experience pain up to 4 years after initial presentation and 25% state significant symptoms up to 20 years later.
Many authors report that a greater Q angle (> 20°) is a risk factor for developing patella-femoral pain syndrome. Also diminished strength or coordination of gluteus medius muscles may be related with an increase in hip internal rotation and adduction, with deleterious effects on the knee. Recently, several studies have reported that interactions of the hip and patella-femoral joint may contribute to PFPS. Increased Q-angle results in excessive valgus angle at the knee, which may be a predisposing factor for PFPS. It is suggested that weak hip abductors and external rotators may not provide sufficient strength to resist hip internal rotation and hip adduction during dynamic activities. The increased knee valgus angle may result in an increased lateral quadriceps muscle force on the patella, resulting in abnormal patellar tracking. PFPS is a common knee problem. Because of its multifactorial condition, the etiology is not completely understood. Recent studies have investigated the presence of hip muscle weakness in subjects in non-weight bearing condition, and drawn the hypothesis that the weak hip muscle strength may cause increased hip adduction and femoral internal rotation. This results in decreasing patellar articular contact area and increasing compressive force across the PF joint, which cause patella-femoral pain. Several kinematic studies have been conducted in PFPS subjects; however, findings are not consistent across the studies. Furthermore, findings are contradictory within the literature. This may occur due to the limited number of the study. Extensive study needs to be conducted to investigate the relationship weak hip muscle strength and knee and hip kinematic.
OBJECTIVE
- To examine the effect of hip and knee muscles strength on patella-femoral pain syndrome.
- To evaluate the effect of knee kinematics on patella-femoral pain syndrome.
- To study relationship of the gluteus muscle strength and the knee and hip kinematics during dynamic postural control task.
REVIEW OF LITERATURE
According to the literature review by Ferris et al. [1], the gluteus maximus also supports the lower extremity against the ground reaction force from full stance to contra lateral toe off during gait. In the same literature review, EMG study observed the maximal activation in the isometric contraction of the hip extensor, abduction with the resistance, hip external rotation, and hyperextension of the trunk and hip in a standing. Strong contraction was also observed at 60-90 degrees of hip flexion. The gluteus maximus is known as a pelvic stabilizer along with the gluteus medius.
Powers et al. [2], using MRI, revealed when knee flexion and extension occurs in weight bearing conditions, a maximal 13 degrees of femoral internal rotation was observed during full knee extension, while the average femoral internal rotation was 5.2 degrees in non weight bearing conditions. Minimal patellar rotation was recorded during weight bearing conditions, while a maximal 16 degrees of patellar rotation was observed at full knee extension in non weight bearing condition. This difference occurs due to screw home mechanism. In a non-weight bearing conditions, the tibia externally rotates on the femoral condyles as the knee goes into extension while the femur internally rotates to fit femoral condyles into the tibia; the tibia is unable to rotate because the distal part is fixed. Therefore, excessive femoral internal rotation increases contact pressure across the PF joint which may lead to anterior and lateral knee pain.
In 2003, Ireland et al. [3] conducted one of the first studies on the relationship between hip strength and PFPS in thirty female subjects. They reported that the maximal isometric voluntary contraction (MVIC) of the hip abduction was 26% (P < .001) lower and hip external rotation was 36% (P < .001) lower in the subjects with PFPS than those of healthy subjects.
Cichanowski et al. [4] observed the peak hip torque of all hip directions (flexion, extension, abduction, adduction, internal rotation, and external rotation) between the symptomatic side and the asymptomatic side of the PFPS subjects, and between the symptomatic side of the PFPS subjects and the healthy subjects. The symptomatic side of the PFPS subjects demonstrated significant weakness in all directions (flexion P=.033, extension P= .029, abduction P=.01 internal rotation P=.049, external rotation P=.033) except for hip adduction (P=.087) compared to randomly selected legs of the control group. Furthermore, weaker hip abduction (P=.003) and external rotation (P=.049) strength were observed in the symptomatic side of PFPS subjects compared to those of the asymptomatic side of the PFPS subjects with no significant difference in other muscles.
In 2003, Brindle et al. [5] conducted one of the first studies to identify EMG activation of the gluteus medius, VMO and VL in relation with knee and hip kinematics during stair ascent and descent in sixteen anterior knee pain (AKP) subjects. PFPS subjects had demonstrated later onset of the gluteus medius EMG onset (P=.035) and shorter duration of EMG activity (P=.032) compared to the healthy group during stair ascent. The stair descent test did not show significant delay of the onset, however, shorter duration of EMG activity was observed in the gluteus medius (P=.049), VMO (P=.023), and VL (P=.032). No significant difference in the knee flexion angle and hip orientation at toe contact was observed between groups in stair descent or ascent conditions (P> .05). Additionally, the task difference did not change the pain perception on the visual analogue scale (VAS) in AKP subjects. No alternation of knee and hip kinematics was observed regardless of the changes in duration and onset of the gluteus medius during stair descent. The investigators suggested that stair descent may not require high demand on neuromuscular control of the knee and hip joint.
Bolgla et al. [6] examined the relationship between the gluteus medius and gluteus maximus MVIC and knee and hip kinematics including knee valgus, hip adduction and hip internal rotation angles during stair descent in eighteen subjects with PFPS. The strength was normalized by the body mass. PFPS subjects demonstrated weaker MVIC of the hip external rotators (P=.002) and hip abductors (P=.006) than those of healthy subjects. The average percentile of the strength in each muscle compared to the healthy subjects was 26% less strength in the hip abductor and 24% less strength in the hip external rotator. The knee and hip angles during the stance phase were measured and averaged. The study demonstrated PFPS subjects had no significant kinematic differences in hip internal rotation (P=.60), hip adduction (P=.15), and knee valgus (P=.28) angles during the stance phase compared to the control group. Although the results were not statistically significant, PFPS subjects demonstrated a 5.7 degree greater knee varus angle (P=.28) compared to healthy subjects, while hip internal rotation was slightly greater (P=.67) and hip adduction was slightly less (P=.15) compared with healthy subjects. The study demonstrated similar strength in hip abductors (22.5 % with Brindle et al. VS 23.3% with Ireland et al.), and hip external rotators (11.1% with Brindle et al. VS 10.8% with Ireland et al.). This study did not demonstrate the relationship that weak hip abductor and external rotators may result in increased hip adduction and hip internal rotation angle. The authors suggested that lack of relationship between hip strength and hip and knee kinematics may have happened because of the task demands chosen in their study, such as stair height, numbers of the trial, and speed, were not sufficient enough to cause the kinematic changes. In addition, since the subjects have been sustaining pain for an average of fourteen months, which indicates a chronic condition, they may have adjusted their knee and hip kinematics to avoid the pain.
Willson et al. [7] assessed the lower extremity kinematics with various activities including single leg squat, running, and single leg jump in twenty female subjects with PFPS. Throughout the activities, PFPS subjects demonstrated an average of 3.5 degrees greater hip adduction (P=.012), 3.9 degrees less hip internal rotation (P=.01) and 4.3 degrees greater knee external rotation angle than the healthy subjects. These results indicated that the task demand did not change the lower extremity kinematics. Although some kinematic changes were observed in this study, it is difficult to draw the conclusion from the result. For example, the authors have suggested that the kinematic data may have included errors, and these may have resulted in decreased hip internal rotation along with increased knee external rotation, which is controversial.
Another study by Wilson et al. [8] observed the influence of fatigue on trunk and hip strength and single leg jump mechanics in the subjects with PFPS. Subjects performed five consecutive single leg jumps, followed by the exertion protocol of ten single leg squats and five single leg jumps to cause fatigue. Immediately after the fatigue protocol, subjects performed another five consecutive single leg jumps. The exertion protocol did not alter the knee and hip kinematic patterns. Both the control and PFPS groups demonstrated similar changes in almost all kinematics except for contra lateral pelvic drop. PFPS subjects demonstrated a significantly greater pelvic drop compared to the healthy subjects, and it became more significant at the end of the exertion protocol (P=.003). However, group differences were observed during the investigation with PFPS subjects compared to the control group: PFPS group demonstrated 5.8 degrees greater in hip flexion (P=.05), 4.2 degrees greater in hip adduction (P=.02), and 4.5 degrees less in hip internal rotation (P=.02) at peak knee extension moment compared to healthy subjects. MVIC strength of the PFPS subjects was 21% less in hip abduction (P< .001), 10% less in trunk lateral flexion (P= .03), and 10% less in hip external rotation (P=.07) than those of healthy subjects. Investigators suggested that the hip and trunk strength is an important factor to PFPS, however, they did not confirm the relationship between hip strength and increased hip external rotation as opposed to the general hypothesis that weak abductor and external rotator may result in increased hip internal rotation.
Dierks et al. [9] observed the knee and hip kinematics in association with hip musculature strength before and after prolonged running with twenty recreational runners. Both PFPS and healthy groups demonstrated significant reduction in hip abductor and hip external rotator MVIC over time (P<.001). PFPS group demonstrated weaker hip abduction before and at the end of running, compared to healthy subjects (P=.045, ES = 0.405). Their study also found a strong relationship between hip frontal plane kinematic and hip abductor MVIC: the hip adduction angle increased as the hip abduction MVIC decreased at the end of running (r = – 0.74). However, there was no statistically significant relationship between hip external rotator strength and hip internal rotation angle (P= .331, ES = 0.190). MVIC in the hip external rotators decreased at the end of running in both PFPS and healthy subjects, but no difference between groups was found. While hip abductor strength showed significant difference before and after running, hip external rotator had no significant difference. In addition, the study found interesting changes in the hip abduction angle between PFPS subjects and healthy subjects from heel strike to full stance during running cycle. Both groups demonstrated a similar hip abduction angle at the heel strike, while hip abduction angle increased toward the mid to late stance and increased hip adduction at the full stance. Conversely, healthy subjects demonstrated increased hip adduction angle toward the mid stance and then increased hip abduction toward the late stance to full stance. At the full stance, hip adduction angle was greater in PFPS subjects than healthy subjects. The authors suggested that this movement occurred in PFPS subjects due to the compensation mechanics of hip abduction. The opposite side of the pelvis tends to elevate in order to abduct the weaker side’s limb, decreasing compressive pressure across the PF joint, and consequently decreasing pain perceived by the PFPS subjects.
Mascal et al. [10] conducted a case study including 14 weeks of rehabilitation, focusing on hip and trunk muscle strengthening with two PFPS subjects. Great improvement was observed in the gluteus medius and gluteus maximus strength in both subjects. One subject demonstrated a 50% increase in the gluteus medius, a 55% increase in the gluteus maximus, a 317% increase in external rotators, and a 20% increase in the quadriceps strength. The other subject demonstrated a 110% increase in the gluteus medius, a 90% increase in the gluteus maximus, a 15% increase in external rotators, and 10% increase in the quadriceps. Along with these results, both subjects also demonstrated kinematic improvement. One subject demonstrated increased hip external rotation from 1.4 degrees internal rotation to 2.6 degrees external rotation and decreased hip adduction angle from 8.7 degrees to 2.3 degrees during step down.
Additionally, kinematic assessment demonstrated a decrease in hip adduction, hip internal rotation, and contra lateral pelvic drop during gait. The hip adduction angle increased at the last 85% of the stance phase during step down activity, however, post rehabilitation data indicated that the hip adduction angle was decreased at the last 80% of the stance phase. Similar kinematic changes were observed in step down activity compared with the pre rehabilitation measurement. Pain perception was improved in both subjects, with one subject being able to stand, walk, ascend and descend stairs without pain. The other subjects reported great reduction in pain to ascend and descend stairs with occasional minimal discomfort. The intervention was effective to these subjects. The ideal outcomes may be because of the close attention on the subjects during on site rehabilitation. The subjects were closely monitored by the therapist so that the subjects were able to collect their kinematics if they were not appropriate. In addition, a deficit of hip strength was the factor contributing to PFPS for those subjects. Although the result was based on the case studies of two PFPS subjects, outcomes could support the concept that hip muscle weakness may contribute to PFPS. Future study should be conducted with larger population for validation.
Olmstead et al. [11] observed the reach distance in eight directions in subjects with chronic ankle instability. Lateral and antero-lateral reaches had significantly shorter reach than all other directions, and a longer reach in the posterior and postelo-medial directions compared with the healthy limbs. The researchers also found the sum of the reaching distances in all eight directions for the chronic ankle instability subjects was shorter than that of healthy subjects as well as healthy limb of the chronic ankle instability subjects.
Gribble et al. [12] observed a shorter reach distance and less knee flexion angle with subjects with chronic ankle instability compared with healthy subjects. The SEBT has also been used to predict the lower extremity injuries in a high school basketball team.
Pliskey et al. [13] measured three directions of the SEBT (anterior, postero-medial, and postero-lateral). Subjects with an average of four centimetres reach difference between right and left leg had 2.5 times more of a chance of sustaining a lower extremity injury during the season. They also found 6.5 times more chance of lower extremity injuries in females, with less than 94% of the average of all three directions normalized to the limb length. While most studies of the SEBT had been done with the ankle, there are only few studies that had investigated the influence of knee pathology during the SEBT.
Aminaka and Gribble [14] demonstrated a decrease in the normalized reach distance in the anterior direction, along with an associated increase in pain, in twenty subjects with PFPS, compared with twenty healthy subjects.
Ebersole et al. [15] reported a shorter reach distance in the posterior direction in PFPS subjects compared with healthy subjects.
Earl and Hertel [16] quantified the integrated electromyographic (iEMG) activation patterns of the VMO, vastuslateralis, medial hamstrings, biceps femoris, anterior tibialis, and gastronemius, and knee and ankle saggital plane kinematics during the SEBT. They found that quadriceps activity was greatest in anterior reach direction while hamstrings activity was greatest in posterior direction. The gastronemius did not change its activities, regardless of the direction. Knee flexion angle was greater in the anterior, antero-medial, medial, and postero-lateral directions (P < .05) than the other directions. Ankle dorsiflexion was greater in anterior, antero-medial, and medial directions than that of other directions (P < .0005). Gluteus medius is a primary hip abductor and secondary hip external rotator; while the gluteus maximus is a primary hip extensor and external rotator. EMG studies have observed these two muscles are activated during a single leg squat in concentric and eccentric manner to control knee and hip kinematics in the frontal plane. Considering that the knee and hip movements occurring at the SEBT are similar to those of a single leg squat, the SEBT will be an appropriate method to measure the activation of those two muscle groups, while adding additional challenges related to the production of dynamic postural control.
METHODOLOGY
The proposed study is case control cohort (prospective) study of Influence of Hip muscles and knee kinematics on Patello-femoral pain syndrome. This Study has been done at Sriganganagar College of Allied Health Sciences, Sriganganagar, Rajasthan after approval of the institutional scientific & ethical committee.
SAMPLE SIZE – Twenty subjects participated in this study and completed the test (PFPS: Age= 21.07±3.27yrs, Ht= 172.09±10.26cm, Mass= 69.96±9.05kg;
Control: Age= 20.93±3.00yrs, Ht= 170.18 ±8.94cm, Mass= 70.25 ±8.57kg)
All subjects had no history of osteoarthritis, surgery (including arthroscopy), fracture, patellar dislocation/subluxation, or ligamentous or other soft-tissue injury, or a concussion within the last year. Additionally, the PFPS subjects presented with diffuse, unilateral anterior knee pain for at least 8 weeks, exacerbated by stair climbing, sitting, walking, running, squatting, knee flexion and isometric quadriceps contraction. In addition, none of the subjects could be participating in physical therapy 30 days prior to the study.
Control subjects were matched for sex, age, weight, and mass. Additionally, control subjects were designated a matched “injured side” for the purposes of between group comparisons. For instance, if the first PFPS subject had a symptomatic right side, then the right limb of the subsequent matched control subject was used. The subjects read and sign the informed consent before participating in the study.
METHOD OF COLLECTION OF DATA- Subjects reported to Sriganganagar College of Allied Health Sciences, Sriganganagar, Rajasthan. They read and signed the informed consent approved by the Institutional review board.
The subjects were evaluated for 1) static kinematics in anatomical position (i.e. knee valgus and knee varus angle), 2) normalized average EMG of the GMed ,GMax, and VM activities during SEBT, 3) normalized reaching distance (MAXD) during the SEBT, 4) kinematic changes of the knee in frontal plane at the touchdown of the SEBT, and 5) VAS for measuring subjective pain pre-test, during test and post-test. These measures were assessed on the injured limb of the PFPS subjects and a matched limb of the Control group, designated for both groups as the “test limb”. For instance, if the symptomatic side/test limb of a PFPS subject was the right limb, then the matched limb of a matched Control group subject was also the right limb, and served as the test limb.
Subjects were asked to report their knee pain on the visual analogue scale (VAS) (Appendix B) before test. Leg length of the test limb was recorded (cm) at the beginning of the session while lying supine on a plinth from the ASIS to the middle of the medial malleolus. The skin areas for placement of the EMG electrodes on the test limb were cleaned with an alcohol swab, shaved and debrided with sandpaper. A pair of disposable Ag/AgCl surface electrodes (0.8cm diameter, centre-to-centre inter-electrode distance=1.5cm, (Noraxon U.S.A., Inc. Scottsdale, AZ) were used. The electrodes were placed at one-half of the distance between the iliac crest and greater trochanter for the GMed, and at half of the distance between the greater trochanter and ischial tuberosity for the GMax. The electrode placement for VM was approximately 4cm from the superomedial angle of the patella, at 45° to the long axis of the femur.
Maximum voluntary isometric contraction (MVIC) of both muscle groups for the testing leg was measured according to previously published methods.
GMed MVIC was measured with subjects in the side-lying position on a treatment table. Subjects were asked to abduct the hip approximately 30° with slight hip external rotation and extension and hold it in place against the strap at the distal posterior thigh.
The MVIC of GMax for hip extension was measured in the prone position with 90° knee flexion while the pelvis is stabilized by the strap. Subjects performed 30° of hip extension against the other strap positioned at the distal posterior thigh.
The MVIC of GMax for hip external rotation was performed while the subject was seated on a treatment table with the hip and knee flexed to 90°. The subject was asked to bring the foot toward the midline of the body against the strap positioned at the medial malleolous.
Knee extension MVIC was performed in a sitting position similar to the hip external rotation MVIC. The subject was asked to bring the knee into approximately 30° flexed position, and then held the position against the strap. The MVICs were performed three times for five seconds for each muscle. For each MVIC trial, the three seconds that showed the highest amplitude of activation were recorded for data analysis. Following five minutes rest after completing the MVIC measurement; electromagnetic sensors were attached at the sacrum, lateral thigh, lateral shank, and foot. The wires and sensors were secured to the skin with an elastic tape or a strap.
For the SEBT, subjects were asked to stand on the middle of the SEBT mat on the test limb in bare feet with their hands on their hips. Subjects were instructed to reach into the anterior direction along the tape measure, using the toes of the non-standing leg to make a touch as lightly as possible, and then return to the starting point, resuming a double-leg stance. The speed of the task was selected at subjects’ preference. For this study, the anterior direction was used as the reaching directions. The reaching distance was marked and measured in centimetres. All measures were recorded by the same investigator. Prior to the test, after demonstration by the PI, subjects were allowed to complete four practice trials to reduce the learning effect. Following five minutes of rest, subjects performed five test trials reaches. Each trial was separated by 15 seconds of rest. Subjects were asked to repeat the trial if the stance foot was lifted while reaching, the subject did not make a touchdown on the designated line, or the subject lost balance and shifted the stance foot or touched down in an attempt to recover during the trials.
The recorded reach distance was normalized to the measured leg length and reported as a percentage, based on previous study (%MAXD).
During the testing session, subjects were asked to report the amount of perceived pain associated with the SEBT task using a VAS. The VAS instrument was administered before the practice trials begin, immediately upon completion of all the test trials (rating their worst pain during the test performance), and also five minutes after completing the test. The subjects were asked to place a mark on the horizontal line that corresponded with the level of pain they perceived in their injured limb for each of these assessments. The placement of the mark was measured in millimetres from the left side of the line (No Pain) and recorded as the pain score.
The EMG of three muscle groups during the MVICs and the SEBT was collected through the 16-channel telemeterized EMG system integrated with the Motion Monitor data acquisition system, using a sampling rate of 1000 Hz. The EMG data was measured from the beginning of the SEBT to the end of the SEBT. The mean iEMG data during the SEBT was normalized by the mean iEMG value of three seconds of MVIC.
The EMG data was filtered with a band pass filter (low pass 500Hz, high pass of 20 Hz). The data was exported to a custom made Excel (Microsoft Corp, Redmond, WA) spreadsheet to calculate the iEMG value. The iEMG was defined as the area under the linear envelope of each EMG activation. iEMG data of the MVIC was divided by 3000 ms to obtain average EMG. iEMG of the SEBT was divided by the amount of time (ms) which each subject needed to complete the task to calculate average EMG during the SEBT. The average EMG of the GMed, GMax (hip extensor and hip external rotator) and VM from the five trials for each muscle were calculated and normalized by the average EMG from the MVICs of each muscle.
Simultaneously, knee kinematics were collected by with the electromagnetic tracking system and a standard range transmitter using a sampling rate of 100 Hz, and integrated with the Motion Monitor software. The frontal plane angle of the knee was recorded at the furthest reach during the SEBT. A 3rd order low pass Butterworth filter with a cut off at 20 Hz was applied to the kinematic data. A virtual event marker was placed in the data by a co-investigator observing the trials so that the point of maximum reach is designated and the kinematic and EMG data may be time-matched. A virtual marker was placed at the beginning and the end of the task as well. The knee valgus angle was recorded as a frontal plane kinematic value at the point of touch down (visually noted and annotated with a virtual event marker during testing), and from the beginning to touch-down during the SEBT.
DATA ANALYSIS
For the dependent variables, the means and standard deviation were used for statistical analysis. For each of these variables, paired t-test were employed to compare the data between the PFPS and control groups for EMG, SEBT and Knee valgus angle. For dependent variable #4, the VAS data was a single assessment at each time point. A one-between (Group) and one-within (Time) repeated measures ANOVA was performed for the VAS data. Level of significance was set at p < .05 for all analyses. In the event of statistically significant interaction (VAS only), a Tukey’s post-hoc test was applied.
Power analysis calculation
The power analysis was based on data collected from the research laboratory of the faculty advisor and published work by other authors that utilized similar dependant variables (GMed EMG, MAXD, knee valgus angle) and comparisons that were used in this proposed study. Using these data and an online statistical calculator, sample size with a desired level of statistical significance at p<.05 and a power level equal to or greater 0.80 was calculated.
%MAXD
In a recently published study under the direction of the faculty advisor subjects with (n=20) and without PFPS (n=20) performed the anterior reach of the SEBT. Those with PFPS produced significantly less normalized reaching distance (63.15±1.3%) compared to Healthy control subjects (65.2±1.3%). Based on this relationship, to achieve a power of .80, 8 subjects per group were needed.
Knee Valgus Angle
Claiborn et al. reported the amount of maximum knee valgus angle during a single-leg squat in healthy subjects to be (3.21±4.92º). Assuming that the SEBT is a series of single-leg squats, this task could be used as a comparison to the SEBT. In that study, only healthy subjects were examined. In our study, we would hope to observe at least a 10% difference in knee valgus angle between the PFPS and healthy subjects.
GMed EMG
Brindle et al. examined the difference in GMed duration during a stair descent task between those with and without PFPS. The control subjects produced a significantly increased duration in GMed activation (758±115.7 ms) compared to the PFPS subjects (758±115.7 ms). Based on these means and standard deviations, to achieve a power level of .80, 10subjects/group was needed in this study.
Summary of power analyses
Based on these calculations, we needed 10 subjects with PFPS and 10 healthy control subjects to achieve a statistical power level of .80. Therefore, a total of 20 subjects were enrolled in this study.
RESULTS
Knee valgus angle
There was a significant difference between groups for knee valgus angle at touch down during the anterior reach on the SEBT (p= .022, t=-2.40) (Figure1). The PFPS group demonstrated greater knee valgus angle (-2.266±10.278°) compared to the control group (7.081±10.008°) (Figure1). There was a large effect size associated with this difference (d=0.92).
During the SEBT, the PFPS group also demonstrated significantly less knee varus displacement (1.953± 9.933°) compared to the control group (11.689 ± 8.920°) (p=.011. t=-2.70) (Figure2). There was a large effect size with this difference (d=1.03).
Figure 1. Frontal Knee Kinematic at Touchdown (Knee Valgus)
* indicates group difference (p= .022, t= -2.40, ES=0.92).
Figure 2. Frontal Knee Kinematics Displacement
* indicates group difference (p=.011, t= -2.70, ES=1.03).
Normalized reach distance (%MAXD)
There was a statistically significant difference between groups for normalized reach distances in the anterior reach (p=.014, t=-2.60). The PFPS group demonstrated shorter MAXD (66.17 ± 5.0%) compared with the control group (70.84 ± 4.40%) (Figure3). There was a large effect size associated with this difference (d=0.97).
Figure 3. Normalized Reach Distance (%MAXD)
* indicates group difference (p= .014, t= -2.60, ES=0.97).
Normalized reach distance (%MAXD) = (Reach distance / leg length)*100
Pain on the Visual Analogue Scale (VAS)
There was a statistically significant group by time interaction for VAS (F2,52=4.70, p<.001). Tukey’s post hoc revealed that the PFPS group demonstrated significantly increased pain at pre-, during, and post- test compared to the control group (PFPS: Pre=0.807 ± 1.136, during=2.607 ± 1.477, post=1.714 ± 1.310, Control: pre=0.079±0.267, during=0.243±0.539, post=0.086±0.266) (Figure 4). Large effect sizes were associated with these differences (pre-test: d=0.88, during test: d=2.13, post-test: d=1.72) (Table 5). Furthermore, the PFPS group demonstrated that pain during the test as well as during the post-test was significantly higher compared to pre-test pain; additionally post-test pain was significantly less compared to the pain during the test. (Figure 4). There was also moderate to large effect size related to these results (pre vs. during: d=1.37, pre vs. post: d=0.76, during vs. post: d=0.62).
Figure 4. Visual Analogue Scale (VAS), Group by time interaction (F2,52=4.70, p<.001)
* indicates group difference at pre- during, and post- tests.
# indicates significant difference between pre- and during tests within the PFPS group.
† indicates significant difference between pre- and post- tests within the PFPS group.
% indicates significant difference between during and post-test within the PFPS group.
Normalized average EMG of the vastusmedialis during the SEBT
The PFPS group demonstrated significantly greater normalized average EMG compared to the control group (p=.048, t=2.072, PFPS=132.5±77.2%, Control=87.7±23.0%) (Figure 5). There was a large effect size associated with this difference (d=0.89) .
Figure 5. Normalized Average EMG of VastusMedialis (%MVIC)
* indicate group difference
(p= .048, t=2.072, ES=0.89).
Normalized average EMG of the gluteus medius during the SEBT (%MVIC)
There was no statistically significant group difference (p= .790, t=-0.270, PFPS=42.91±23.22%, Control=45.41±25.77%) (Figure 6). A small effect size was associated with this result (d=0.10).
Figure 6. Normalized Average EMG of the Gluteus Medius (%MVIC)
(p= .790, t= -.270, ES=0.10)
Normalized average EMG of the gluteus maximus (hip extensors) during the SEBT (%MVIC)
There was no statistically significant difference in the EMG of the gluteus maximus for the hip extensor between groups (p= .136, t=1.537, PFPS= 28.6±10.51%, Control= 15.7±68.6%) (Figure 7). There was a moderate effect size associated with this difference (d=0.58).
Figure 7. Normalized Average EMG of the Gluteus Maximus
(%MVIC) (Hip Extensors)
(p= .136, t= 1.537, ES=0.58)
Normalized average EMG of the gluteus maximus (hip external rotators) during the SEBT (%MVIC)
There was no statistically significant difference observed in the EMG of the gluteus maximus for the hip external rotator (p= .171, t=1.409, PFPS= 229.83±133.03%, Control= 166.56±102.61 %) (Figure 8). There was a small effect size was associated with this result (d=0.53).
Figure 8. Normalized Average EMG of the Gluteus Maximus (%MVIC) (Hip External Rotator)
(p= .171, t= 1.409, ES=0.53)
DISCUSSION
Knee kinematic alteration
It was hypothesized that PFPS subjects would demonstrate an increased knee valgus angle during performance of the SEBT compared to the healthy subjects. Our results support this hypothesis, since the PFPS group demonstrated increased valgus angle at the touchdown during the anterior direction of the SEBT. In addition, the PFPS group demonstrated significantly smaller varus displacement from the initiation of the touchdown event during the reaching task compared to the control group. Large effect size helps to support these findings. It has been suggested that insufficient hip abductor and hip external rotator strength might be associated with dynamic malalignment, such as increased knee valgusangle. Weak hip abductor and external rotators may not resist hip adduction and hip internal rotation during a dynamic postural control task, allowing an increased knee valgus angle. This malalignment increases contact pressure on the patellofemoral joint, which may contribute to wearing of patellar articular cartilage as the patella slides superiorly and inferiorly on the internally rotated femur as knee flexes and extends, potentially resulting in PFPS. The result supported our hypothesis, but the finding is contradictory to a previous study that investigated knee valgus angle during the stair descent task between PFPS and healthy subjects.
Hip and knee musculature activation
It was hypothesized that PFPS subjects would demonstrate reduced muscle activities of GMed, GMax and VM during performance of the SEBT compared to the healthy subjects. Our hypotheses were not supported as our study did not find significant differences in GMed and GMax EMG activities during the anterior reach of the SEBT, while subjects with PFPS demonstrated increased VM normalized average EMG compared with the healthy subjects during the anterior reach of the SEBT. In addition, there was a large effect size associated with VM activation, which may help to supports this significant difference between groups.
It was unexpected that the subjects with PFPS, who have been presumed to have weakness of the VM, would demonstrate significantly higher VM activity during the SEBT compared to the healthy group. Several studies have shown significantly delayed onset of VM relative to the vastuslateralis in subjects with PFPS compared with that of healthy subjects during stair ascent and descent tasks. Furthermore, previous studies have demonstrated that the quadriceps strengthening decreased knee pain in the VAS although the rehabilitation protocol included knee and hip muscle strengthening.
Considering that, we expected less VM activities during the SEBT in the PFPS subjects. Our results may be due to the increased VM eccentric contraction during the down phase of the SEBT. The evidence that subjects with PFPS reported increased pain during the SEBT in our study could help to explain this result. Because PFPS is a chronic condition, most subjects with PFPS likely would know that knee flexion or extension would cause knee pain. In addition, a previous study observed that the subjects with PFPS reported increased knee pain during stair descent compared to the stair ascent. Therefore, subjects with PFPS tend to be cautious to flex their knees by slowing down this movement (increasing the duration), which may be eventually increasing the duration of the reach task and total normalized average EMG activation of the eccentric contraction of the VM. Future study should investigate the duration and activation of the eccentric and concentric contraction phase separately in both PFPS and healthy groups for the comparison. It was also unexpected that the PFPS group would demonstrate similar normalized average EMG s of GMed and GMax to those of the healthy group during the SEBT. Although no statistically significant difference was found in GMax activation as a hip extensor or hip external rotator, there was moderate effect sizes associated with these results. In our study, the PFPS subject demonstrated increased hip extensors and external rotators EMG activities compared to the control subjects. It may indicate that the increased hip extensors’ or external rotators’ activities may be associated with the kinematic and VM EMG alteration. It should be noted that the normalized average EMG of hip external rotators exceeded 100%, which may indicate that subjects could not perform MVIC of hip external rotation; therefore EMG activities during the SEBT exceeded that of MVIC.
Pain on the VAS
It was hypothesized that PFPS subjects would experience more knee pain presented by the visual analogue scale (VAS) at rest compared to the healthy subjects. In addition, we hypothesized that the VAS score would increase during performance of the anterior reach task on the SEBT compared to pre and post performance in the PFPS subjects. Our study demonstrated that the subjects with PFPS reported more knee pain at pre, during, and post test compared to the healthy subjects. Furthermore, the subjects with PFPS demonstrated increased knee pain during and post tests compared to the pre test. Increased knee pain may indicate that the anterior reach task on the SEBT is appropriate task to induce knee pain in the PFPS subjects and may be associated with shorter reach distance in the subjects with PFPS compared with that of healthy subjects. While exacerbation of pain did not seem to alter the hip muscle activities perhaps the observed alterations of the hip and knee kinematic were influenced by pain. Future analysis of the data will explore these relationships.
Normalized anterior reach distance (%MAXD)
It was hypothesized that the healthy subjects would reach farther than PFPS subjects during the anterior reach task of the SEBT, indicating a poor dynamic postural control in the PFPS subjects. Our results supported this hypothesis, since PFPS subjects demonstrated shorter reach distance on the SEBT compared to the healthy subjects, and is supported by previous investigation. Since subjects with PFPS demonstrated increased pain during the SEBT relative to that in the pre test, the reduction in the anterior reach may be affected by the knee pain. Furthermore, increased knee valgus angle in the subjects with PFPS may affect this reach distance reduction. As it is known that the presence of the knee valgus angle accompanies other kinematic abnormalities of the lower extremity such as foot pronation, tibial internal rotation, pelvic rotation, lateral pelvic drop, we could speculate that increased knee valgus angle may have contributed to the decreased anterior reach distance of the SEBT in the subjects with PFPS. With increased knee valgus angle, the opposite side of the pelvis tends to rotate externally, which may result in the reduction of the distance. Previous studies have reported reduced MVIC of the hip abductor, hip extensor, and hip external rotator groups, assuming that this weakness may result in the increased valgus angle during the dynamic activities. Therefore, we may assume that less normalized average EMG activities would be present with PFPS. However, GMed and GMax normalized average EMG activities during the SEBT remained similar between PFPS and control groups. Therefore, this reduction in anterior reach distance may not be related with the normalized average EMG activity of those muscles.
CONCLUSION
The results derived from our study indicate that PFPS subjects demonstrate increased knee valgus angle in the anterior reach task on the SEBT. In addition, the PFPS group demonstrated shorter reach distance on the SEBT, along with increased pain on the VAS. On the contrary to our hypothesis, subjects with PFPS demonstrated greater VM activities than healthy subjects. In the sagittal plane movement, VM may play an important role to maintain the balance, while GMed and GMax may not be the primary muscle for the postural control during the task.
REFERENCES
- Ferris E, Heckler A, Maitland L, Taylor C. A structured review of the role of gluteus maximus in rehabilitation.J Physiotherapy. 2005; 33(3): 95-100
- Powers CM, et. al. The influence of altered lower-extremity kinematics on patellofemoral joint dysfunction: A theoretical perspective. J Orthop Sports PhysTher.2003; 33(11): 639-646.
- Ireland ML, Willson JD, Ballantyne BT, Davis IM. Hip strength in females with and without patellofemoral pain. J Orthop Sports PhysTher.2003; 33(8): 671-676.
- Cichanowski HR, Schmitt JS, Niemuth PE. Hip strength in collegiate female athletes with patellofemoral pain. Med Sci Sports Exerc.2007;39 (8)1227-1232.
- Brindle TJ, Mattacola C, McCrory J. Electromyographic changes in the gluteus medius during stair ascent and descent in subjects with anterior knee pain. Knee Surg Sports TraumatolArthrosc. 2003;11(4): 244-51.
- Bolgla LA, Malone TR, Umberger BR, Uhl TL. Hip strength and hip and knee kinematics during stair descent in females with and without patellofemoral pain syndrome. J Orthop Sports PhysTher. 2008; 38(1): 12-8.
- Willson JD, Davis IS. Lower extremity mechanics of females with and without patellofemoral pain across activities with progressively greater task demands.ClinBiomech. 2008; 23(2):203-11.
- Willson JD, Binder-Macleod S, Davis IS. Lower extremity jumping mechanics of female athletes with and without patellofemoral pain before and after exertion.Am J Sports Med. 2008; 36(8):1587-96.
- Dierks TA, Manal KT, Hamill J, Davis IS. Proximal and distal influences on hip and knee kinematics in runners with patellofemoral pain during a prolonged run. J Orthop Sports PhysTher.2008; 38(8):448-56.
- Mascal CL, Landel R, Powers C. Management of patellofemoral pain targeting hip, pelvis, and trunk muscle function: 2 case reports. J Orthop Sports PhysTher.2003; 33(11): 647-60
- Olmsted LC, Carcia CR, Hertel J, Shultz SJ. Efficacy of the Star Excursion Balance Tests in Detecting Reach Deficits in Subjects with Chronic Ankle Instability.J Athl Train. 2002 Dec; 37(4):501-506.
- Gribble P, and Hertel J. Consideration for normalizing measures of the star excursion balance test. MeasPhysEduExercSci.. 2003; 7(2): 89-100.
- Plisky PJ, Rauh MJ, Kaminski TW, Underwood FB. Star Excursion Balance Test as a predictor of lower extremity injury in high school basketball players. J Orthop Sports PhysTher.2006; 36(12): 911-9.
- Aminaka N, Gribble PA. Patellar taping, patellofemoral pain syndrome, lower extremity kinematics, and dynamic postural control.J Athl Train.2008; 43(1): 21-28.
- Ebersole KT, Sabin MJ, Haggard HA, Kusch BM. The influence of patellofemoral pain on the star excursion balance test performance. J Athl Train.2008; 43(3) (Suppl): S-49-50.
- Earl JE, and Hertel J. Lower-extremity muscle activation during the star excursion balance tests. Sports Rehabil. 2001; 10(2):93-104.
- Gribble PA, Hertel J, Denegar CR, Buckley WE. The effects of fatigue and chronic ankle instability on dynamic postural control.J Athl Train.2004; 39(4):321-329.
- Hertel J, Miller J, Dendgar CR. Intratester and intertester reliability during the star excursion balance tests. Sports Rehabil.2000; 9: 104-116.
- Anderson FC, and Pandy MG. Individual muscle contractions to support in normal walking. Gait &posure. 2003: 17:159-169.
- Powers CM, Ward SR, Fredericson M, Guillet M, Shellock FG. Patellofemoral kinematics during weight-bearing and non-weight-bearing knee extension in persons with lateral subluxation of the patella: a preliminary study. J Orthop Sports PhysTher.2003; 33(11): 677-85.
- Robinson RH, Gribble PA. Support for a reduction in the number of trials needed for the star excursion balance test. Arch Phys Med Rehabil.2008; Feb: 89(2):364-70.
- Willson JD, Davis IS. Utility of the frontal plane projection angle in females with patellofemoral pain.J Orthop Sports PhysTher.2008; 38(10):606-15.
- Delagi EF, ed. Anatomic guide for the electromyographer – the limbs. 2nd ed. Springfield, IL: Charles C Thomas Publisher; 1981.
IMPACT OF NEURAL MOBILIZATION IN SCIATICA
Dr Sheenam Popli
Lecturer (Faculty of Medical Para-Medical And Allied Health Sciences)
Tantia University, Sri Ganganagar (Rajasthan) 335001 India
Neural mobilization is a treatment modality used in relation to pathologies of the nervous system. It has been suggested that neural mobilization is an effective treatment modality, although support of this suggestion is primarily anecdotal. Richard F. Ellis & Wayne H. Ping (2008) conducted a study to provide a systematic review of the literature pertaining to the therapeutic efficacy of neural mobilization. Their review study revealed that there is only limited evidence available to support the use of neural mobilization. They suggested that future research needs to re-examine the application of neural mobilization with use of more homogeneous study designs and pathologies; in addition, it should standardize the neural mobilization interventions used in their study.
Sciatica is a medical condition of pain going down the leg from the lower back. This pain may go down the back, outside, or front of the leg. Typically, symptoms are only on one side of the body. Certain causes, however, may result in pain on both sides. Lower back pain is sometimes but not always present. Weakness or numbness may occur in various parts of the leg and foot. About 90% of the time sciatica is due to a spinal disc herniation pressing on one of the lumbar or sacral nerve roots. Other problems that may result in sciatica include spondylolisthesis, spinal stenosis, piriformis syndrome, pelvic tumors, and compression by a baby’s head during pregnancy. Treatment initially is typically with pain medications. It is generally recommended that people continue with activities to the best of their abilities. Often all that is required is time and in about 90% of people the problem goes away in less than six weeks.
OBJECTIVE
- To overview the concept of neural mobilization and sciatica.
- To study the effectiveness of neural mobilization in persons with sciatica.
REVIEW OF LITERATURE
Kuslich, S. D., Ulstrom, C. L., & Michael, C. J. (1991) in an effort to define the origin of low back pain and sciatica, 193 patients were carefully studied using progressive local anesthesia. These patients had surgery for herniated discs, spinal stenoses, or both. Various tissues were stimulated during the performance of these lumbar spinal operations. This article discusses our observations and the results of that study. Bush, K., Cowan, N., Katz, D. E., & Gishen, P. (1992) assessed the natural history of sciatica due to lumbosacral nerve root compromise and to evaluate the pathomorphologic changes that accompany the natural resolution of the disease. One hundred sixty-five consecutive patients, 114 males and 51 females, with an average age of 41 years (range, 17-72) and an average duration of symptoms of 4.2 months (range, 1-72) presenting with sciatica thought to be due to lumbosacral nerve root compromise were admitted to the study. The cornerstone of treatment was the serial epidural administration of steroid and local anesthetic by the caudal route on an outpatient basis. Lumbar epidural injection or periradicular infiltration at the appropriate level, confirmed under image intensifier, was the next step before considering surgical decompression. An average of three injections (range, 0-8) was received by each patient. Patients underwent clinical examination and computed tomography. Twenty-three patients (14%) underwent surgical decompression. The remainder were clinically assessed at 1 year after presentation, and 111 were rescanned at the appropriate levels. All conservatively managed patients made a satisfactory clinical recovery: average reduction of pain on the visual analog scale was 94% (range, 45-100), and 64 (76%) of the 84 disc herniations and 7 (26%) of the 27 disc bulges showed partial or complete resolution (chi-square = 20.27 P = 0.0001). Thus a high proportion of patients with discogenic sciatica make a satisfactory recovery with aggressive conservative management, and this recovery is accompanied by resolution of disc herniations in a significant number. Only a small proportion of patients needed surgical decompression. Bill Vicenzino, David Collins & Tony Wright (1994) investigated the effect of two spinal manipulative therapy techniques on skin conductance and skin temperature in the distal C6 dermatome of asymptomatic subjects. The effects of the two spinal manipulative therapy techniques were compared. A randomised, repeated measures, double blind, placebo controlled study design was used to investigate the physiological effect of a C5/6 left lateral glide technique (grade III) with the right upper limb in either the upper limb tension test 1 (LG1) or the upper limb tension test 2b (LG2b) position. Thirty-four normal asymptomatic subjects participated in the study. LG2b and LG1 produced significantly greater increases in skin conductance than did placebo or control. LG2b produced a greater increase than did LG1 but this was not significant. There were no such significant changes in skin temperature. These results provide objective evidence of a physiological effect that is produced by the spinal manipulative therapy techniques under consideration. Koes, B. W., Scholten, R. J., Mens, J. M., & Bouter, L. M. (1995) assessed the efficacy of epidural steroid injections for low-back pain. Data was obtained using computer-aided search of published randomized clinical trials and assessment of the methods of the studies. Twelve randomized clinical trials evaluating epidural steroid injections were identified. Data was extracted based on scores for quality of the methods, using 4 categories (study population, interventions, effect measurement, and data presentation and analysis) and the conclusion of the author(s) with regard to the efficacy of epidural steroid injections. Method scores of the trials ranged from 17 to 72 points (maximum 100 points). Eight trials showed method scores of 50 points or more. Of the 4 best studies (> 60 points), 2 reported positive outcomes and 2 reported negative results. Overall, 6 studies indicated that the epidural steroid injection was more effective than the reference treatment and 6 reported it to be no better or worse than the reference treatment. There appeared to be no relationship between the methodological quality of the trials and the reported outcomes. In conclusion, there are flaws in the design of most studies. The best studies showed incosistent results of epidural steroid injections. The efficacy of epidural steroid injections has not yet been established. The benefits of epidural steroid injections, if any, seem to be of short duration only. Future research efforts are warranted, but more attention should be paid to the methods of the trials. J. McGuiness, B. Vicenzino & A. Wright (1997) reported that Spinal manipulative therapy techniques are frequently applied by physiotherapists to relieve pain of musculo-skeletal origin and to improve the quality of joint movement in a variety of musculo-skeletal conditions. However, there has been little research into the physiological effects of these techniques, or the mechanisms responsible for these effects. The aim of this study was to establish whether a grade III postero-anterior mobilization technique applied centrally to the cervical spine would affect respiratory and cardiovascular indicators of sympathetic nervous system function in pain-free, normal volunteers. A significant increase in respiratory rate, heart rate, systolic and diastolic blood pressure occurred during application of the technique to C5/6, when compared to the control and placebo conditions. There was little change in any of the measured variables during the placebo condition. This study provides objective evidence that application of this mobilization technique elicits changes in sympathetic nervous system activity distinct from placebo in pain-free individuals. These results provide a basis for further research into the physiological effects of manipulative procedures, and in particular, exploration of the mechanisms responsible for analgesia produced by this method. Scrimshaw S.V. & Maher C.G. (2001) determined whether the addition of neural mobilization to standard postoperative care improved the outcome of lumbar spinal surgery. Summary of Background Data. It has been suggested that neural mobilization should be performed after spinal surgery to prevent nerve root adhesions and improve outcome. However, to date, there is no convincing evidence of the value of neural mobilization. Methods- Eighty-one patients undergoing lumbar discectomy, fusion, or laminectomy at a private hospital in Sydney were randomly allocated to standard postoperative care or standard care plus neural mobilization. Neural mobilization included passive movements and active exercises designed to mobilize the lumbosacral nerve roots and sciatic tract. Primary outcome measures were global perceived effect measured on a 7-point scale, pain measured using visual analogue scales and the McGill Pain Questionnaire, and disability measured with the Quebec Disability Scale. Results- All patients received the treatment as allocated with 12-month follow-up data available for 76 patients (94% of those randomized). There were no statistically significant or clinically significant benefits provided by the neural mobilization treatment for any outcome. Conclusions- The neural mobilization protocol evaluated in this study did not provide an additional benefit to standard postoperative care for patients undergoing spinal surgery. The authors advocate that this protocol not be used in clinical practice. Joshua Cleland, Gary C. Hunt & Jessica Palmer (2004) postulated that neural tissue mechano-sensitivity contributes to symptoms associated with peripheral neurogenic pain disorders. However, there is a paucity of literature regarding the most effective clinical practices for managing pain of peripheral neurogenic origin. As clinical use of neural mobilization continues to flourish in the management of these pain syndromes, it is imperative to document outcomes associated with these techniques. The purpose of this single-case A1-B1-A2-B2 design was to investigate the effectiveness of neural mobilization in the management of a 29-year-old female patient with symptoms suggestive of peripheral neurogenic involvement. The intervention phases (B1 and B2) consisted of neural mobilizations specifically directed at the sciatic continuum. Outcome measures (degrees of hip flexion during the straight-leg-raise and pain) demonstrated both visual improvement and statistically significant improvements following implementation of the neural mobilization techniques. This single-case design provides a measure of scientific support for the use of neural mobilizations with patients presenting with lower extremity neurogenic pain disorders. However, generalizability is poor, and further methodologically sound clinical trials are necessary to investigate the effectiveness of neural mobilization in a larger patient population. Dimitrios Kostopoulos (2004) mentioned that Carpal tunnel syndrome (CTS) results from the entrapment of the median nerve at the wrist. It is the most common entrapment syndrome causing frequent disability especially to working populations. Aside from the surgical release approach there are other non-invasive therapeutic methods for the treatment of CTS. This paper will review the evidence regarding neuro-dynamic testing and neuro-mobilization of the median nerve as a treatment approach to CTS. Richard Ellis, Wayne Hing, Andrew Dilley & Peter McNair (2008) stated that Diagnostic ultrasound provides a technique whereby real-time, in vivo analysis of peripheral nerve movement is possible. This study measured sciatic nerve movement during a “slider” neural mobilisation technique (ankle dorsiflexion/plantar flexion and cervical extension/flexion). Transverse and longitudinal movement was assessed from still ultrasound images and video sequences by using frame-by-frame cross-correlation software. Sciatic nerve movement was recorded in the transverse and longitudinal planes. For transverse movement, at the posterior mid-thigh (PMT) the mean value of lateral sciatic nerve movement was 3.54 mm (standard error of measurement [SEM] ± 1.18 mm) compared with anterior-posterior/vertical (AP) movement of 1.61 mm (SEM ± 0.78 mm). At the popliteal crease (PC) scanning location, lateral movement was 6.62 mm (SEM ± 1.10 mm) compared with AP movement of 3.26 mm (SEM ± 0.99 mm). Mean longitudinal sciatic nerve movement at the PMT was 3.47 mm (SEM ± 0.79 mm; n = 27) compared with the PC of 5.22 mm (SEM ± 0.05 mm; n = 3). The reliability of ultrasound measurement of transverse sciatic nerve movement was fair to excellent (Intraclass correlation coefficient [ICC] = 0.39–0.76) compared with excellent (ICC = 0.75) for analysis of longitudinal movement. Diagnostic ultrasound presents a reliable, non-invasive, real-time, in vivo method for analysis of sciatic nerve movement. Michelle L. Heebner & Toni S. Roddey (2008) determined whether neural mobilization in addition to standard care is more effective than standard care alone in the treatment of Carpal Tunnel Syndrome (CTS). Sixty participants were randomly assigned to one of two groups. Group 1 received standard care, and Group 2 performed a neuro-dynamic mobilization exercise in addition to standard care. Outcomes were assessed at baseline and at one and six months using the Disabilities of the Arm, Shoulder, and Hand Questionnaire, the Brigham and Woman’s Hospital Carpal Tunnel Specific Questionnaire (CTSQ), and elbow extension range of motion during an upper limb median nerve tension test. There were no significant differences in the outcome measures between groups, except Group 1 had improved scores on the function status scale of the CTSQ compared to Group 2 at six months. The addition of neural mobilization to standard care did not result in improved outcomes in patients with CTS. Jason M, Beneciuk, Mark D. Bishop & Steven Z. George (2009) investigated potential mechanisms of neural mobilization (NM), using tensioning techniques in comparison to sham NM on a group of asymptomatic volunteers between the ages of 18 and 50. Background: NM utilizing tensioning techniques is used by physical therapists in the treatment of patients with cervical and/or upper extremity symptoms. The underlying mechanisms of potential benefits associated with NM tensioning techniques are unknown. Methods And Measures: Participants (n = 62) received either a NM or sham NM intervention 2 to 3 times a week for a total of 9 sessions, followed by a 1-week period of no intervention to assess carryover effects. A-delta (first pain response) and C-fiber (temporal summation) mediated pain perceptions were tested via thermal quantitative sensory testing procedures. Elbow extension range of motion (ROM) and sensory descriptor ratings were obtained during a neuro-dynamic test for the median nerve. Data were analyzed with repeated-measures analysis of variance (ANOVA). Results: No group differences were seen for A-delta mediated pain perception at either immediate or carryover times. Group differences were identified for immediate C-fiber mediated pain perception (P = .032), in which hypoalgesia occurred for the NM group but not the sham NM group. This hypoalgesic effect was not maintained at carryover (P = .104). Group differences were also identified for the 3-week and carryover periods for elbow extension ROM (P = .004), and for the participant sensory descriptor ratings (P = .018), in which increased ROM and decreased sensory descriptor ratings were identified in participants in the NM group but not the sham NM group. Conclusion: This study provides preliminary evidence that mechanistic effects of tensioning NM differ from sham NM for asymptomatic participants. Specifically, NM resulted in immediate, but not sustained, C-fiber mediated hypoalgesia. Also, NM was associated with increased elbow ROM and a reduction in sensory descriptor ratings at 3-week and carryover assessment times. These differences provide potentially important information on the mechanistic effects of NM, as well as the description of a sham NM for use in future clinical trials. Gladson R.F. Bertolini, Taciane S. Silva, Danilo L. Trindade, Adriano P. Ciena & Alberito R. Carvalho (2009) verified the effectiveness of neural mobilization and static stretching in reducing pain in rats submitted to experimental sciatica.
METHODS: The rats (n=23) were divided into three groups: sham (SG/n=8), without intervention; stretching (STCG/n=8), treated with static stretching; and neural mobilization (NMG/n=7), treated with neural mobilization. The animals underwent an experimental model of sciatica by compression of the right ischiatic nerve with catgut suture thread. There were five consecutive sessions of treatment that began on the third day after lesion. The pain caused by the sciatica was evaluated by a functional incapacitation test that measured paw elevation time (PET), and values over 10s were indicative of pain. PET was measured at the following moments: before the lesion (M1), immediately before (M2) and after the first session (M3), immediately after the last session (M4) and 24h after the last session (M5). ANOVA was applied with repeated measures and unrepeated measures for intra- and inter-group comparison, respectively. RESULTS: In the SG, post-lesion PETs were greater than M1 (p<0.001), suggesting persistence of pain. In the STCG, post-lesion PETs were greater than M1 (p<0.001), but lower when comparing M3 vs. M4 (p<0.05) and M3 vs. M5 (p<0.01) suggesting the effectiveness of the treatment. In NMG, M2, M3 (p<0.001) and M4 (p<0.05) were greater in relation to M1, but not M5, showing that this treatment re-established the normal PET values. CONCLUSION: Both forms of therapy were effective in reducing pain, with neural mobilization being the more effective of the two. Sahar M. Adel (2011) conducted a study to investigate the effect of lumbar mobilization techniques and neural mobilization technique on sciatic pain, functional disabilities, centralization of symptoms in patients, latency of Hoffmann reflex, and of degree of nerve root compromise in chronic low back dysfunction (LBD). Pre-test post-test group design has been used. Sixty patients with chronic (LBD) from both sexes were involved, aged between 30 – 60 years. They were divided into two equal groups, Group (A) received lumbar spine mobilization and exercise intervention and Group (B) received Straight leg raising stretching (SLR) in addition to lumbar mobilization and exercise. Self-report measures included a body diagram to assess the distribution of symptoms, numeric pain rating scale (NPRS), modified Oswestry Disability Index (ODI), Patients recorded the location of their symptoms on the body diagram to determine the extent to which centralization occurred after treatment, The results of study revealed that: there was a significant difference between both groups on pain (p = 0.006), functional disabilities improvement (0.001), location of symptoms (p = 0.083) and sciatic nerve root compression (p = 0.035). However there is no significant Differences in H-reflex latency (p = 0.873) between group A and group B (post-test). It is concluded that straight leg raising (SLR) stretching may be beneficial in the management of patients with LBD. SLR stretching in addition to lumbar spine mobilization and exercise was beneficial in improving pain, reducing short-term disability and promoting centralization of symptoms in this group of patients. Castilho, J., Ferreira, L. A. B., Pereira, W. M., Neto, H. P., da Silva Morelli, J. G., Brandalize, D., … & Oliveira, C. S. (2012) mentioned that Hypertonia is prevalent in anti-gravity muscles, such as the biceps brachii. Neural mobilization is one of the techniques currently used to reduce spasticity. Objective: The aim of the present study was to assess electro-myographic (EMG) activity in spastic biceps brachii muscles before and after neural mobilization of the upper limb contralateral to the hemiplegia. Materials and Methods: Repeated pre-test and post-test EMG measurements were performed on six stroke victims with grade 1 or 2 spasticity (Modified Ashworth Scale). The Upper Limb Neuro-dynamic Test (ULNT1) was the mobilization technique employed. Results: After neural mobilization contralateral to the lesion, electro-myographic activity in the biceps brachii decreased by 17% and 11% for 90° flexion and complete extension of the elbow, respectively. However, the results were not statistically significant (p gt; 0.05). Conclusions: When performed using contralateral techniques, neural mobilization alters the electrical signal of spastic muscles.
Santos, F. M., Silva, J. T., Giardini, A. C., Rocha, P. A., Achermann, A. P., Alves, A. S., … & Chacur, M. (2012) Background: The neural mobilization technique is a noninvasive method that has proved clinically effective in reducing pain sensitivity and consequently in improving quality of life after neuropathic pain. The present study examined the effects of neural mobilization (NM) on pain sensitivity induced by chronic constriction injury (CCI) in rats. The CCI was performed on adult male rats, submitted thereafter to 10 sessions of NM, each other day, starting 14 days after the CCI injury. Over the treatment period, animals were evaluated for nociception using behavioral tests, such as tests for allodynia and thermal and mechanical hyperalgesia. At the end of the sessions, the dorsal root ganglion (DRG) and spinal cord were analyzed using immune histochemistry and Western blot assays for neural growth factor (NGF) and glial fibrillary acidic protein (GFAP). Results: The NM treatment induced an early reduction (from the second session) of the hyperalgesia and allodynia in CCI-injured rats, which persisted until the end of the treatment. On the other hand, only after the 4th session we observed a blockade of thermal sensitivity. Regarding cellular changes, we observed a decrease of GFAP and NGF expression after NM in the ipsilateral DRG (68% and 111%, respectively) and the decrease of only GFAP expression after NM in the lumbar spinal cord (L3-L6) (108%). Conclusions: These data provide evidence that NM treatment reverses pain symptoms in CCI-injured rats and suggest the involvement of glial cells and NGF in such an effect. Richard F. Ellis & Wayne A. Hing (2013) mentioned that Neural mobilization is a treatment modality used in relation to pathologies of the nervous system. It has been suggested that neural mobilization is an effective treatment modality, although support of this suggestion is primarily anecdotal. The purpose of this paper was to provide a systematic review of the literature pertaining to the therapeutic efficacy of neural mobilization. A search to identify randomized controlled trials investigating neural mobilization was conducted using the keywords neural mobilisation/mobilization, nerve mobilisation/mobilization, neural manipulative physical therapy, physical therapy, neural/nerve glide, nerve glide exercises, nerve/neural treatment, nerve/neural stretching, neuro-dynamics, and nerve/neural physiotherapy. The titles and abstracts of the papers identified were reviewed to select papers specifically detailing neural mobilization as a treatment modality. The PEDro scale, a systematic tool used to critique RCTs and grade methodological quality, was used to assess these trials. Methodological assessment allowed an analysis of research investigating therapeutic efficacy of neural mobilization. Ten randomized clinical trials (discussed in 11 retrieved articles) were identified that discussed the therapeutic effect of neural mobilization. This review highlights the lack in quantity and quality of the available research. Qualitative analysis of these studies revealed that there is only limited evidence to support the use of neural mobilization. Future research needs store-examine the application of neural mobilization with use of more homogeneous study designs and pathologies; in addition, it should standardize the neural mobilization interventions used in the study.
METHODOLOGY
The present study is a mixed method type of research. It is an approach to inquiry that combines or associates both qualitative and quantitative forms. It involves philosophical assumptions, the use of qualitative and quantitative approaches and the mixing of both approaches in a study. The present study is aimed to find out the effectiveness of neural mobilization in persons suffering from sciatica. The study was conducted at the department of physiotherapy and rehabilitation Tantia General Hospital Ganganagar (Rajasthan). Thirty patients attending the physical therapy outpatient department of Tantia General Hospital Ganganagar (Rajasthan) were include in the study after they met the following criteria. In order to screen the subjects according to the inclusion/ exclusion criteria, subjects had to complete a screening examination and investigation. Once the subjects registered themselves in the Out Patient Department with the complaint of radiating low back pain, they were assessed according to format given by Andersson & Deyo (1996). Differential diagnosis with other back conditions mimicking sciatica was established. If the subjects were found to have sciatica, all inclusion and exclusion criteria were checked.
Method of Data Collection: Range of motion was measured using goniometer. A Visual Analog Scale was used for assessing the pain. Patients were conveniently allocated either to group A or to group B
Group A (n=15) Experimental Group
•Sciatic Nerve Mobilization
•Traction
•TENS
•MHP
Group B (n=15) Control Group
•Traction
•TENS
•MHP
Neural mobilization was given for approximately 10 minutes per session including 30 sec hold and 1 min rest. The straight leg raise was done for inducing longitudinal tension as the sciatic nerve runs posterior to hip and knee joints. The leg was lifted upward, as a solid lever, while maintaining extension at the knee. To induce dural motion through the sciatic nerve, the leg was raised past 35 degrees in order to take up slack in the nerve. Since the sciatic nerve is completely stretched at 70 degrees, pain beyond that point is usually of hip, sacroiliac, or lumbar spine origin (David, 1997). The unilateral straight leg raise causes traction on the sciatic nerve, lumbosacral nerve roots, and dura mater. Adverse neural tension produces symptoms from the low back area extending into the sciatic nerve distribution of the affected lower limb.
To introduce additional traction (i.e., sensitization) into the proximal aspect of the sciatic nerve, hip adduction was added to the straight leg raise. The average total treatment time was approximately 30-40 minutes per session and the whole treatment was given for 9 sessions. Pain free ROM at hip and VAS was recorded at the end of every 3rd, 6th and 9th sessions. The patients were instructed not to do any type of exercise at home or take any medications.
DATA ANALYSIS
Data was analyzed using the SPSS version 14 for Microsoft Windows.
Independent t-test was performed to compare the ROM and pain on VAS scale between groups A & B at 0, 3rd, 6th and 9th sessions. Paired t test was also performed to compare improvement on 0-3rd, 3rd -6th, 6th -9th and 0-9th sessions within the two groups. The significance (Probability-P) was selected as 0.05.
Fifteen subjects were taken in each group A and B with the mean age of 56.1 and 58.3 years respectively (Table 1).
Table 1: Subject information
Serial No. Group N Age YRS
(Mean ± S.D.)
1 A 15 56.1 ± 4.95
2 B 15 58.3 ± 4.37
___________________________________________________________________________
At zero session the mean of ROM of group A was 39.67 and that of group B was 42.33. When comparison of mean ROM was done between Group A and Group B at zero session the t value was found to be 0.794 which was insignificant. Thus there was no disparity in ROM at the starting of the treatment session between the two groups (Table 2).
Table 2: Comparison of mean values of ROM between group A and group B
S.No. Group N ROM
(Mean ± S.D.)
S 0 S 3 S 6 S 9
___________________________________________________________________________
1 A 15 39.67 53.00 71.00 86.33
±7.90 ±6.49 ±7.37 ±6.67
2 B 15 42.33 50.00 59.33 67.33
±10.33 ±11.80 ±11.16 ±10.67
3 T Value 0.79 0.863 3.38 5.85
S stands for session number
At the end of 3rd session mean of ROM of group A was 53.00 and that of group B was 50.00, the difference in the means was insignificant. At the end of 6th session mean of ROM of group A was 71.00 and that of group B was 59.33, the t value was 3.38 and was significant. At the end of 9th session mean of ROM of group A was 86.33 and that of group B was 67.33 the t value was 5.85 and was significant (Table 2).
Similarly the reduction in pain was noted through VAS score and was evaluated using independent t test. At zero session the mean of VAS of group A was 7.4 and that of group B was 7.13 and the t value was found to be 0 .587 which was insignificant (table 3).
Table No 3: Comparison of mean of VAS score between group A and group B
S.No. Group N ROM
(Mean ± S.D.)
S 0 S 3 S 6 S 9
___________________________________________________________________________
1 A 15 7.40 5.27 3.47 1.67
±1.24 ±1.22 ±0.99 ±0.98
2 B 15 7.13 6.20 5.53 4.60
± 1.25 ±1.42 ±1.13 ±1.12
3 T Value 0.59 1.926 5.34 7.64
S stands for session number
At the end of 3rd session the mean ± SD of VAS of group A was 5.27±1.22 and that of group B was 6.20±1.42 and the t value was found to be 1.926 which was insignificant. At the end of 6th session the mean ± SD of VAS of group A was 3.47±0.99 and that of group B was 5.53±1.13 and the t value was found to be 5.34 which was significant. Similarly at the end of 6th session the mean ± SD of VAS of group A was 1.67±0.98 and that of group B was 4.60±1.12 and the t value was found to be 7.64 which were significant. Thus ROM and VAS showed significant results only by the end of 6th and 9th sessions, whereas the results at the end of 3rd session were insignificant (table 3).
Paired T test was done to compare the improvement between 0-3rd, 3rd-6th, 6th-9th and 0-9th sessions. The mean difference of ROM of group A between 0 to 3rd session was 13.33±4.87 whereas that of group B was 7.67±4.17 and their t values were 4.82 and 4.32 respectively.
Thus group A showed more significant improvement than group B from 0 to 3rd session. Similarly between 3rd and 6th session the mean difference of group A was 18.00±2.50 whereas that of group B was 9.33±4.58 and the t values were 5.28 and 4.47 respectively. Between 6th to 9th sessions the mean difference of group A was 15.33±4.42 and that of group B was 8.00±4.14. The t values were 5.01 and 4.39 respectively. Between 0 and 9th session the mean difference of group A was 46.67±4.49 and of group B was 25.00 ± 8.45. The t values were 5.33 and 4.89 respectively (table 4).
Table No 4: Comparison of Mean Difference of ROM within Group A and B
S. No. Section Group Mean ± S.D. T Value
1 0-3 A 13.33 ± 4.87 4.82
B 7.67 ± 4.17 4.32
2 3-6 A 18.00 ± 2.50 5.28
B 9.33 ± 4.58 4.47
3 6-9 A 15.33 ± 4.42 5.01
B 8.00 ± 4.14 4.39
4 0-9 A 46.67 ± 4.49 5.33
B 25.00 ± 8.45 4.89
___________________________________________________________________________
Table No 5: Comparison of Mean Difference of VAS within Group A and B
S. No. Section Group Mean ± S.D. T Value
1 0-3 A 2.13 ± 0.35 5.25
B 0.93 ± 0.70 3.75
2 3-6 A 1.80 ± 0.56 4.96
B 0.67 ± 0.82 0.76
3 6-9 A 1.80 ± 0.41 5.14
B 0.67 ± 1.23 1.98
4 0-9 A 5.73 ± 0.88 5.27
B 2.27 ± 1.58 3.9
___________________________________________________________________________
Comparison of improvement in VAS score was calculated similarly using the paired t test. The mean difference of VAS for group A between 0 to 3rd session was 2.13±0.35 and that of group B was 0.93±0.70, their t values were 5.25 and 3.75 respectively. Thus group A demonstrated more significant improvement than group B. Similarly between 3rd and 6th sessions the mean difference of group A was 1.80±0.56 whereas that of group B was 0.67±0.82 and the t values were 4.96 and 0.76 respectively. Between 6th and 9th sessions the mean difference of group A was 1.80±0.41 whereas that of group B was 0.67±1.23 and the t values were 5.14 and 1.98 respectively. Between 0 and 9th session the mean difference of group A was 5.73±0.88 and of group B was 2.27±1.58. The t values were 5.27 and 3.9 respectively (table 5).
RESULT & DISCUSSION
The result of this study shows that neural mobilization technique is effective in increasing range of motion at hip and decreasing pain thus reducing the symptoms of sciatica. The mean value of group A where neural mobilization was given shows more significant increase as compared to group B. When the comparison of means of ROM and VAS was done between group A and B by the end of 3rd session there was no significant increase in the ROM (t=0.863) or decrease in the VAS (t=1.926) scores. Thus it is concluded that the effectiveness of neural mobilization was observed only by the end of 6th session for ROM (t=3.379), as well as pain (t= 5.339). By the end of 9th session again there was a significant increase in ROM (t= 5.84) and decrease in VAS score (t= 7.634). Thus neural mobilization technique given to group A proved more effective than the conventional treatment for sciatica administered to group B. Effectiveness of neural mobilization is thought to be due to neural “flossing” effect, that is, its ability to restore normal mobility and length relationship, and consequently, blood flow and axonal transport dynamics in compromised neural tissue. Neural mobilization is very effective in breaking up the adhesions and bringing about mobility. The results of this study also depict the same. The conventional treatment effectively reduces pain and increases ROM at the joint but is unable to eliminate the root cause of the problem. According to Carey et al (1995), it helps in providing symptomatic relief only.
Limitations
- Lesser number of subjects
- No group had similar patients with same degree of involvement
- Age variation from 40-50 years
- Patient’s built was variable
- Proper strengthening program was not followed after neural mobilization sessions due to lack of time
Clinical Implication
This study provides some evidence for use of Neural Mobilization as an adjunct to conventional exercise therapy regime in Sciatica. This study suggests that Neural Mobilization is effective in the treatment of Sciatica.
This study provides preliminary evidence that neural mobilization is effective in the treatment of Sciatica.
CONCLUSION
It is concluded from the study that neural mobilization helps in reducing pain and other symptoms of sciatica. Neural mobilization technique is effective in increasing range of motion at hip and decreasing pain thus reducing the symptoms of sciatica. Neural mobilization technique given to group A proved more effective than the conventional treatment for sciatica administered to group B. Neural mobilization is very effective in breaking up the adhesions and bringing about mobility. The conventional treatment effectively reduces pain and increases ROM at the joint but is unable to eliminate the root cause of the problem
REFERENCES
Arkava, M.L. & Lane, T.A. (1983). Beginning social work research. Boston/London: Allyn and Bacon.
Adel, S. M. (2011). Efficacy of neural mobilization in treatment of low back dysfunctions. Journal of American Science, 7(4), 566-573.
Bush, K., Cowan, N., Katz, D. E., & Gishen, P. (1992). The natural history of sciatica associated with disc pathology: a prospective study with clinical and independent radiologic follow-up. Spine, 17(10), 1205-1212.
Beneciuk, J. M., Bishop, M. D., & George, S. Z. (2009). Effects of upper extremity neural mobilization on thermal pain sensitivity: a sham-controlled study in asymptomatic participants. journal of orthopaedic & sports physical therapy, 39(6), 428-438.
Bertolini, G. R., Silva, T. S., Trindade, D. L., Ciena, A. P., & Carvalho, A. R. (2009). Neural mobilization and static stretching in an experimental sciatica model: an experimental study. Brazilian Journal of Physical Therapy, 13(6), 493-498.
Carette, S., Leclaire, R., Marcoux, S., Morin, F., Blaise, G. A., St.-Pierre, A., … & Montminy, P. (1997). Epidural corticosteroid injections for sciatica due to herniated nucleus pulposus. New England Journal of Medicine, 336(23), 1634-1640.
Carragee, E. J., Han, M. Y., Suen, P. W., & Kim, D. (2003). Clinical outcomes after lumbar discectomy for sciatica: the effects of fragment type and anular competence. J Bone Joint Surg Am, 85(1), 102-108.
Collis, J. & Hussey, R. (2003) Business Research: a practical guide for undergraduate and postgraduate students, second edition. Basingstoke: Palgrave Macmillan.
Cleland, J., Hunt, G. C., & Palmer, J. (2004). Effectiveness of neural mobilization in the treatment of a patient with lower extremity neurogenic pain: a single-case design. Journal of Manual & Manipulative Therapy, 12(3), 143-152.
Castilho, J., Ferreira, L. A. B., Pereira, W. M., Neto, H. P., da Silva Morelli, J. G., Brandalize, D., … & Oliveira, C. S. (2012). Analysis of electromyographic activity in spastic biceps brachii muscle following neural mobilization. Journal of bodywork and movement therapies, 16(3), 364-368.
De Vos, A. S., (2005). Research at Grass Roots: A Primer for the Caring Profession. Cape Town: Van Schaik Publishers.
Ellis, R. F., & Hing, W. A. (2008). Neural mobilization: a systematic review of randomized controlled trials with an analysis of therapeutic efficacy. Journal of manual & manipulative therapy, 16(1), 8-22.
Ellis, R., Hing, W., Dilley, A., & McNair, P. (2008). Reliability of measuring sciatic and tibial nerve movement with diagnostic ultrasound during a neural mobilisation technique. Ultrasound in medicine & biology, 34(8), 1209-1216.
Frymoyer, J. W. (1988). Back pain and sciatica. New England Journal of Medicine, 318(5), 291-300.
Heebner, M. L., & Roddey, T. S. (2008). The effects of neural mobilization in addition to standard care in persons with carpal tunnel syndrome from a community hospital. Journal of Hand Therapy, 21(3), 229-241.
Kuslich, S. D., Ulstrom, C. L., & Michael, C. J. (1991). The tissue origin of low back pain and sciatica: a report of pain response to tissue stimulation during operations on the lumbar spine using local anesthesia. The Orthopedic clinics of North America, 22(2), 181-187.
Koes, B. W., Scholten, R. J., Mens, J. M., & Bouter, L. M. (1995). Efficacy of epidural steroid injections for low-back pain and sciatica: a systematic review of randomized clinical trials. Pain, 63(3), 279-288.
Kostopoulos, D. (2004). Treatment of carpal tunnel syndrome: a review of the non-surgical approaches with emphasis in neural mobilization. Journal of bodywork and movement therapies, 8(1), 2-8.
Lindblom, K. (1948). Diagnostic puncture of intervertebral disks in sciatica. Acta orthopaedica scandinavica, 17(1-4), 231-239.
McB urney, D. H. (2001). Research Methods. London: Wadsworth Thomson Learning.
Patrick, D. L., Deyo, R. A., Atlas, S. J., Singer, D. E., Chapin, A., & Keller, R. B. (1995). Assessing health-related quality of life in patients with sciatica. Spine, 20(17), 1899-1908.
Smyth, M. J., & Wright, V. J. (1958). Sciatica and the intervertebral disc. The Journal of Bone & Joint Surgery, 40(6), 1401-1418.
Scrimshaw, S. V., & Maher, C. G. (2001). Randomized controlled trial of neural mobilization after spinal surgery. Spine, 26(24), 2647-2652.
Santos, F. M., Silva, J. T., Giardini, A. C., Rocha, P. A., Achermann, A. P., Alves, A. S., … & Chacur, M. (2012). Neural mobilization reverses behavioral and cellular changes that characterize neuropathic pain in rats. Molecular pain, 8(1), 1.
Vicenzino, B., Collins, D., & Wright, T. (1994). Sudomotor changes induced by neural mobilisation techniques in asymptomatic subjects. Journal of Manual & Manipulative Therapy, 2(2), 66-74.
Watts, R. W., & Silagy, C. A. (1995). A meta-analysis on the efficacy of epidural corticosteroids in the treatment of sciatica. Anaesthesia and intensive care, 23(5), 564-569.
Comparison between the effects of core exercises with Mckenzie method versus core exercises with Myofascial release Technique in stage – 2 of lumbar disc prolapse
Dr. Manash Kanti Chakraborty, MPT Ortho, Deepika Tanwar, MPT Ortho
ABSTRACT
STUDY OBJECTIVES: Comparison between the effects of core exercises with Mckenzie method versus core exercises with Myofascial release Technique in stage – 2 of lumbar disc prolapse.
DESIGN: Pre-test and post-test two group comperative study design. PARTICIPANTS: Thirty subjects aged 30-50 years with clinically diagnosed as stage -2 lumbar disc prolapse were selected under randomized sampling technique and assigned in to two groups with 15 subjects each, one group received core exercises with Mckenzie method and other group core exercises with Myofascial release Technique for a period of 12 weeks.
OUTCOME MEASURES: Visual Analogue Scale (VAS) and Oswestry Disability Questionnaire (ODQ)
RESULT: Patients in core exercises with Myofascial release group shows significantly better than core exercises with Mckenzie method group.
KEY POINT: Core Exercises, Mckenzie method, Myofascial release technique, stage – 2 of lumbar disc prolapse.
INTRODUCTION
A prolapsed lumbar disc is a spine condition that can cause lower back pain, numbness, tingling and muscle weakness in the lower body.it can happen to people of all ages, but becomes more common after the age of 35.
Herniated lumbar disc material (nucleus pulposus or annulus fibrosus) beyond the intervertebral disc space. The highest prevalence is among people aged 30-50 years, with a male to female ratio of 2:1. In people aged 25-55 year, about 95% of herniated discs occur at the lower lumbar spine (l4/5andl5/s1 levels); disc herniation abovet his level is more common in people aged over 55 years.
A prolapsed lumbar disc can occur anywhere in the lumbar region of the spine, specially the vertebrae at the base the disc between these relatively flexible lumbar vertebrae prone to prolapse because the lower back support much of the body’s weight.
As the body ages the discs between our vertebrae begin to lose their elasticity and their ability to bounce back from everyday movement .this creates pressure which pushes the soft inner disc against the fibrous outer layer. Eventually the disc wall can tear and inner material pushes into the spinal column, resulting in a prolapsed disc.
International surveys of low back pain reported that one month prevalence was 19 – 43 % and point prevalence was 15 – 30 %.
The estimated worldwide life time prevalence of low back pain varies from 50 – 84 % .
Experts estimate up to 80% of population will experience back pain at some time of their lives. Worldwide, years lived with disability caused by low back pain have increased by 54
% between 1990 and 2015.
In India over all the prevalence of low back pain found to be 42%. The majority of women (60.9%) with low back pain experienced moderate disability . prevalence of low back pain among women was comparatively more then other studies in India.
There are many back pain myths
- Myth: always sit up straight
Fact: slouching is bad, but sitting up too straight and still for long periods can also be a strain on back.
- Myth : don’t lift heavy things.
Fact : it’s not necessarily how much you lift it’s how you do it .
- Myths : bed rest is the best cure.
Fact : yes, resting can help a recent injury or strain that causes back pain, but a day or two in bed can actually make it worse.
- Myth : exercise is bad for back pain.
Fact : regular exercise prevent back pain.
- Myth : firmer mattresses are better. Fact : medium firm mattress hurt less.
TheMcKenziemethodisaclassificationsystemandaclassificationbasedtreatmentfor patients withlowbackpain. Aacronymfor the Mc Kenziemethodismechanical diagnosis and therapy (MDT) the M c Kenzie method was developed in 1981 byrobin Mc. Kenzie a physical therapist from new Zealand .
Mckenzie exercise are designed to reposition any displaced intervertebral disc. This is initially done by using gravity to draw the disc back into the spine and then actively consolidate the effect of gravity. To facilitate disc movement, when performing the exercise and maintain relaxed and even breathing for the duration of exercise.
The Mckenzie method also referred to as mechanical diagram and therapy is a method of assessing and treating spinal back join and related extremity pain most commonly through the use of specific repeated movements and appropriate prevention measures. The method puts an emphasis on self-core after initial clinical visits it uses primarily self-treatment strategies and minimizes manual therapy procedure with the Mc.kenzie trained therapist supporting the patient with passive procedures only if an individual self- treatment program is not fully effective.
The Mckenzie method also referred to as mechanical diagnosis and therapy is a method of assessing and treating spinal back pain and related extremity pain most commonly through the use of specific repeated movements and appropriate prevention measures.
Centralization – centralization occurs when pain symptoms off-centered from the mid-line of the spine often diagnosed as sciatica, migrate towards the centre of mid-line of the spine this migration of pain symptoms to the centre of lower back is a sign of progress in the Mckenzie method. The most common directional preference that result in centralization is extension of the back.
Classification – there are three primary classification that results from the assessment portion of the Mckenzie method comprehensive approach ; postural syndrome, dysfunction syndrome and derangement syndrome.
Derangement syndrome – the most common treatment classification defined by pain that is experienced due to a disturbance in the joint area resulting in diminished movement in certain directions.
Dysfunction syndrome – this type of pain is categorized by mechanical impairments and deformities of impaired tissue within the body.
Postural syndrome – this type of pain is the result of postural deformation position such as slouching are the cause of postural syndrome.
The McKenzie method exists of 3 steps
- Evaluation
- Treatment
- Prevention
The evaluation is received using repeated movements and sustained positions, with the aim to elicit a pattern of pain responses called centralization .The symptoms of lower limb and lower back are classified into three sub groups: derangement syndrome, dysfunction syndrome and postural syndrome.
The prevention step consist of encouraging the patient to exercise regularly and self-care. The choice of exercises in the McKenzie method is based upon the direction (flexion,
extension or lateral shift of the spine)
The McKenzie method educates patients regarding movement and position strategies can reduce pain.
Principle –
- Kyphotic antalgic management: extension principle
- Acutec or on a lantalgic management: lateral flexion– then– extension principle
- Acute lordotic antalgic management: flexion principle.
Core exercises are a crucial part of any exercise regimen. These exercises strengthen the body, particularly the pelvis hip and lower back areas.
Some examples of this type of exercise include crunches, reverse crunches, ball crunches, and oblique
Crossing over crunches air bicycling plank, butt lifts, back extension with ball and many more.
These exercises work on the deep abdominal muscles, strengthen abs and flatten them, core exercises also make the lower back stronger and healthier.
Doing core exercises stimulates a particular area in the brain called the cerebellum that links to body parts for coordination, spatial awareness.
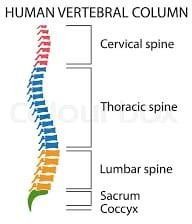
Figure No.1
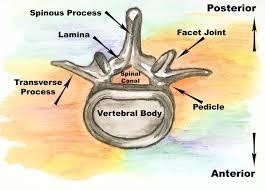
Figure No.2
Mckenzie exercises may be effective in decreasing symptoms, specially leg pain.
Mckenzie exercises centralize back pain, moving it from the leg to the lower back with daily exercises that works to relive acute or chronic pain.
Core exercises support lower back in herniated disc. Core exercises work on lower abdominal muscles.
Core exercises cause flexibility of Spine, give power to muscles provide balance and stability of lower back decrease lower pain and injury.
Core stability is the term used to describe the muscular control required to maintain functional stability around the lumber spine and to prevent lower back pain.
The “core” is often mistaken for the visible abdominal muscles the rectus abdomens, the “abs”, however, the muscles involved can be described as a muscular box and include abdominals in the front (rectus abdominus , transverse abdominus , multifedus, internal oblique) paraspinals and gluteals in the back the diaphragm at the top and the peluic floor on the bottom.
Myofascial release Technique(MFR):
Myofascial release is an alternative medicine therapy that claims to treat skeletal muscle immobility and pain by relaxing contracted muscles, improving blood and lymphatic circulation , and stimulating the stretch reflex in muscles.
The approach was promulgated as an alternative medicine concept by Andrew Toylor still, inventor of osteopathy. The exact phrase “ myofascial release” was coined in the 1960s by Robert ward, an osteopath who studied with Ida Rolf, the originator of rolfing word , along with physical therapist Johan Barnes, are considered the two primary founders of Myofascial release.
Step I: Getting Ready
Step II: Thelengthening processes Step III: Completion
Step IV: Postural integration
Myofascial release is a system of diagnosis and treatment first described by Andrew Taylor still and his early students, which engages continual palpatory feedback to achieve release of myofacial tissues.
Myofascial release techniques have been anecdotally reported as being effective in reliving restrictions and increasing range of motion. Direct MFR techniques engage the restrictive barrier and the tissue is then loaded with a constant force until tissue release/relaxation occurs.
Indirect MRF involves gliding the dysfunctional tissues along the path of least resistance
(away from the barrier) until free movement is achieved.
The goals of myofascial treatment include relaxation of contracted muscles increased circulation to an area of ischemia increase venous and lymphatic drainage and the stimulation of stretch reflexes in hypotonic muscle.
NEED OF THE STUDY
The results of the study may help the physiotherapists to identify and use the appropriate methods in the treatment of stage-2 lumbar disc prolapse patients. This study can also help the physiotherapists in understanding the relation between the different parameters considered for the study under such as VAS (Visual analogue Scale), MMT (Manual muscle Testing), spinal ranges. The study provides an information, that how the study will contribute and who will benefit for it. It includes an explanation of the study’s importance as well as its benefits. By evaluating the results of the study, the physiotherapist able to identify the positive outcomes. The study can help the physiotherapist what impact will these treatment have upon reducing the patient’s problem and promoting health.
With the Mckenzie approach, physical therapy and exercise used to extend the spine can help “centralize” the patient and pain by moving it away from the extremities (leg or arm) to the back.
The long term goal of Mckenzie method is to teach patients suffering from back pain how to treat themselves and manage pain throughout their lives using exercise and other strategies.
Whereas strong core may actually help prevent back pain by making less prone to back injuries and proper spinal alignment. Strengthening core muscles may also help improve back pain.
The focused manual pressure and stretching used in myofascial release therapy loosen up restricted movement leading to reduced pain.
The core exercises with Mckenzie method and core exercises with MFR technique are used in this study to treat the patients and compare the effects of both techniques, because of its effectiveness, easy to understand by the patients, less time consuming and cost effective. Seong Hun Yu, Yong Hyeon Sim, and Hyun Jin kim study the effects of abdominal drawing in exercise and myofascial release on pain flexibility and balance of elderly females who complained of low back pain.
The abdominal drawing in exercise group show significant difference in pain & balance and myofascial release group show significant deference in pain & flexibility after exercise. Macey Berube, BS, in his case report found Mckenzie exercise with core strengthening shows improvement in pain & activity levels motion strength and tenderness.
AIMS OF THE STUDY
To evaluate the comparison of core exercises with McKenzie method in stage-2 lumbar disc prolapse patients. To find the effects of core exercises with Myofascial release Technique in stage- 2 lumbar disc prolapse patients. To compare between the effects of core exercises with Mckenzie method versus core exercises with Myofascial release Technique in stage – 2 of lumbar disc prolapse.
OBJECTIVE OF STUDY
- To evaluate the effects of different exercises
- To compare between the effects of different exercises
- To find out new facts if any at any stage
- To find out the limitations and recommendations
- To verify and test important facts
- To find solution to problem
HYPOTHESIS
Alternate hypothesis:
There is significant difference between the effect of core exercises with McKenzie method and the effect of core exercises with MFR in stage-2 lumbar disc prolapse patients
Null hypothesis:
There is no significant difference between the effect of core exercises and core exercises with Mckenzie method in patient with stage- 2 lumbar disc prolapse.
MATERIALS
Materials used:
- Couch : used for treatment and comfortable position of the patients
- Timer : used to note the treatment time
- Pillows : used to support body parts
- Goniometer: used to measure range of motion of joints
- Paper
- Pencils
- Duly signed Consent forms
OUTCOME MEASURE
- VISUAL ANALOGUE SCALE (VAS)
OSWESTRY DISABILITY QUESTIONNAIRE (ODQ)
METHODOLOGY
STUDY DESIGN
This study design involving the comparative analysis of two groups treated with core exercises with McKenzie method and core exercises with Myofascial release Technique respectively and assessed by VAS (Visual analogue Scale), MMT (Manual muscle Testing) ,spinal ranges.
SAMPLE SIZE:
Fourty subject with stage-2 lumbar disc prolapse aged between 30-50 years were selected according to convenience (purposive) sampling based on the selection criteria.
These subject were then randomly assigned into two groups of twenty subjects each namely experimental group A and experimental group B.
All the participants took part in the experiment on a voluntary basis after signing a consent from and a demographic data was collected from each subject. The purpose of the study was explained to all the subjects.
SAMPLING METHOD: Experimental method STUDY CENTRE: College Opd Dabok INCLUSION CRITERIA:
- Patients clinically diagnosed as stage -2 lumbar disc prolapse.
- Age group from 30-50 years.
EXCLUSION CRITERIA:
- Patients with grade 3, 4 lumbar disc prolapse.
- Age less than 30 and more than 50 years. History of any recent spine surgery.
- History of any spinal diseases.
STUDY DURATION:
- Total duration of study: 12 weeks
- Sessions:1 Session per day
- Duration of sesson:15 to 30 minutes
- Days per week:5 days a week
MEASUREMENT TOOLS:
- Visual analogue scale(VAS)
- Manual muscle testing (MMT)
- Spinal ranges
- Oswestry disability questionnaire(ODQ)
Visual analogue scale(VAS): It was used for pain assessment where by pain was rated from 0
– 10 in which the ‘0’ represented no pain and 10 represented maximum pain tolerance subject were indicated the best number for their pain.
Manual muscle testing (MMT): Manual muscle tests are performed daily by Physiotherapists not only is it used to help predict a patients ability to function it provides a reference with which to document progress.
Grades of MMT-
- none – no visible or palpable contraction
- trace – visible or palpable contraction with no motion. 2 poor – full ROM gravity eliminated
3 fair – full ROM against gravity
good – full ROM against gravity, moderate resistance. 5 normal – full ROM against gravity, maximal resistance .
Spinal ranges – the lumbar spine commonly known as the low back is also tested during range of motion exams the lumbar spine has five vertebrae and connects the spine to the pelvis normal lumbar ranges of motion include 60 degree of flexion 25 degree of extension and 25 degree of lateral or side bending .
Oswestry disability questionnaire (ODQ) : ODQ was completed to assesses percentages of functional disability in patients with lumbar disc prolapse this questionnaire is a gold standard tool indicate ability of patients with lumbar disc prolapse . it consist of 10 section and each of the section includes 6 rates from 0-5. The first section of this questionnaire rates pain and the other section assesses activities of daily living total score of questionnaire was recorded as percentage.
PROCEDURE
40 subject clinically diagnosed as stage-2 lumbar disc prolapse was selected according to inclusion and exclusion criteria and divided randomly into two groups ; namely experimental group A and experimental group B, consisting of 20 subject each.
A brief explanation about the treatment session will explained to all the subjects. The treatment duration for both the group will given as listed below:
Duration per session: 15-30 minutes /session No. of session per day : 1session /day No. of days per week : 5 days a week Duration of the study : 3 months
The visual analogue scale, manual muscle testing , spinal ranges and oswestry disability questionnaire were noted before and at the end of 4th week of treatment group A will treated with core exercises and Mckenzie method group B received core exercises with myofascial technique.
Group A (core exercises with Mckenzie methods): the subject will in a comfortable position support your lower back by sitting upright in a firm chair place feet firmly on floor. Tighten abdominal muscles and bring belly button toward the back of the chair. Hold this tension for 10 seconds.
Bird dog – start on all four limbs and extend the left leg behind you while extending the right arm in front with your thumb up. Compress your abdominal muscles and hold for 10-20 seconds then repeat on the opposite side.
Plank – plank is basically the position in when you are at the top of a push-up. Hold it as long as possible, drawing in your stomach and compressing your lower abs.
Abdominal draw – in supine position drawing the lower abdomen in and then drawing up the pelvic floor muscle so that it contract together with their lower abdomen.
McKenzie exercises fall into 2 categories with opposite movement extension and flexion. Extension and flexion exercises involve moving the spine in opposite directions. Extension exercises by moving spine backward, which is spinal extension. Lie on your abdomen and work up to raising your head and chest off the floor to prop yourself up onto your elbow flexion exercises involve bending the spine forward, in the opposite direction as spinal extension . flexion exercises can be perform by seated standing or lying on back . bringing knees to your chest while lying down is an example of a lying flexion exercise. (Reference No.14)
Group B core exercises with MFR (Myofascial release technique): core exercises are mention above with MFR (Myofascial release technique)
- Land on the surface of the body with the appropriate “tool” (knuckles, or forearm tc)
- Sink in to the soft tissue.
- Contact the first barrier/restricted layer.
- Put in a “line of tension”.
- Engage the fascia by taking up the slack in the tissues.
- Finally move or drag the fascia across the surface while staying it touch with the underlying layers.
- Exit gracefully.
- Data collection-
All the data was collected with outcome measure and kept safely for statistical analysis.
- Statistical test-
An appropriate statistical tests will be applied to the data for analysis.
- Limitation-
Will be able to present only after the detail study has been carried out.
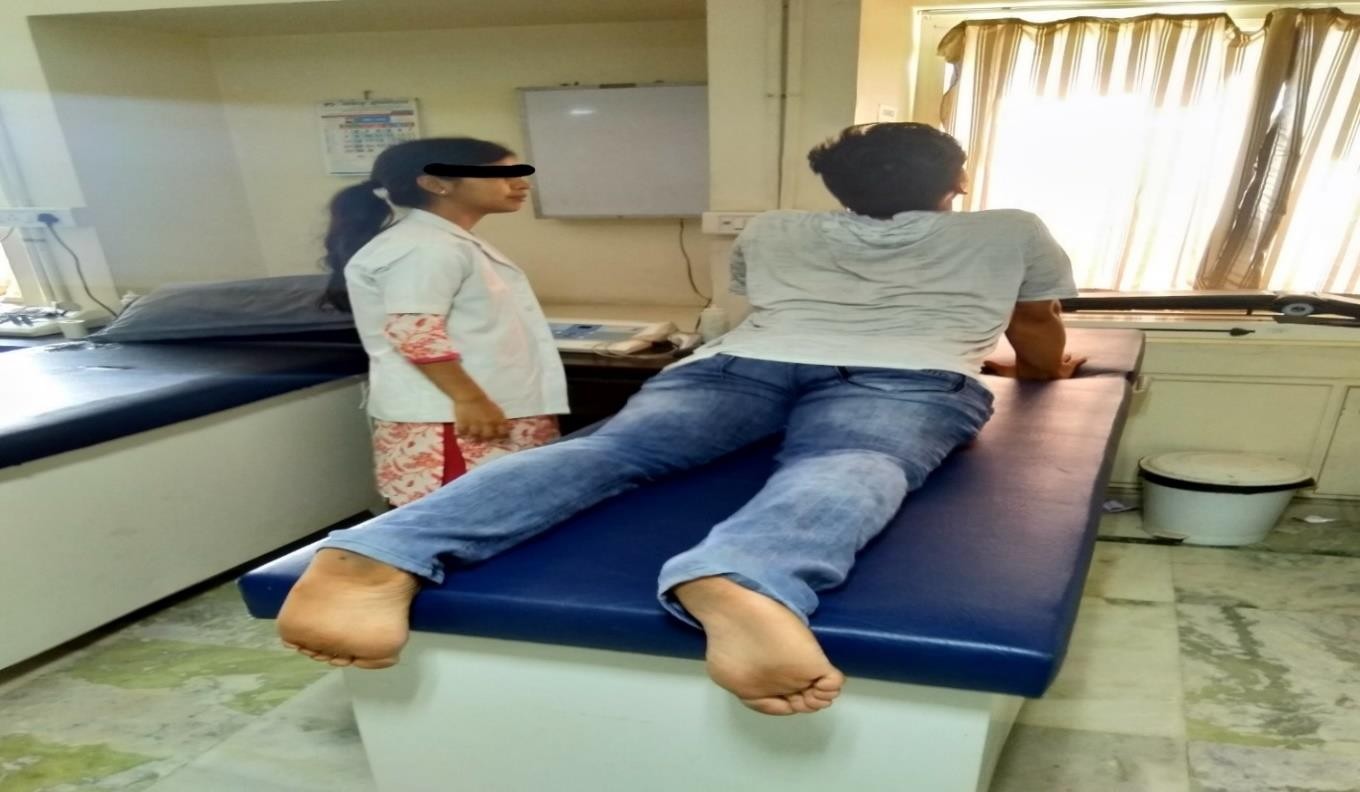
Figure No.3 McKenzie extension exercise
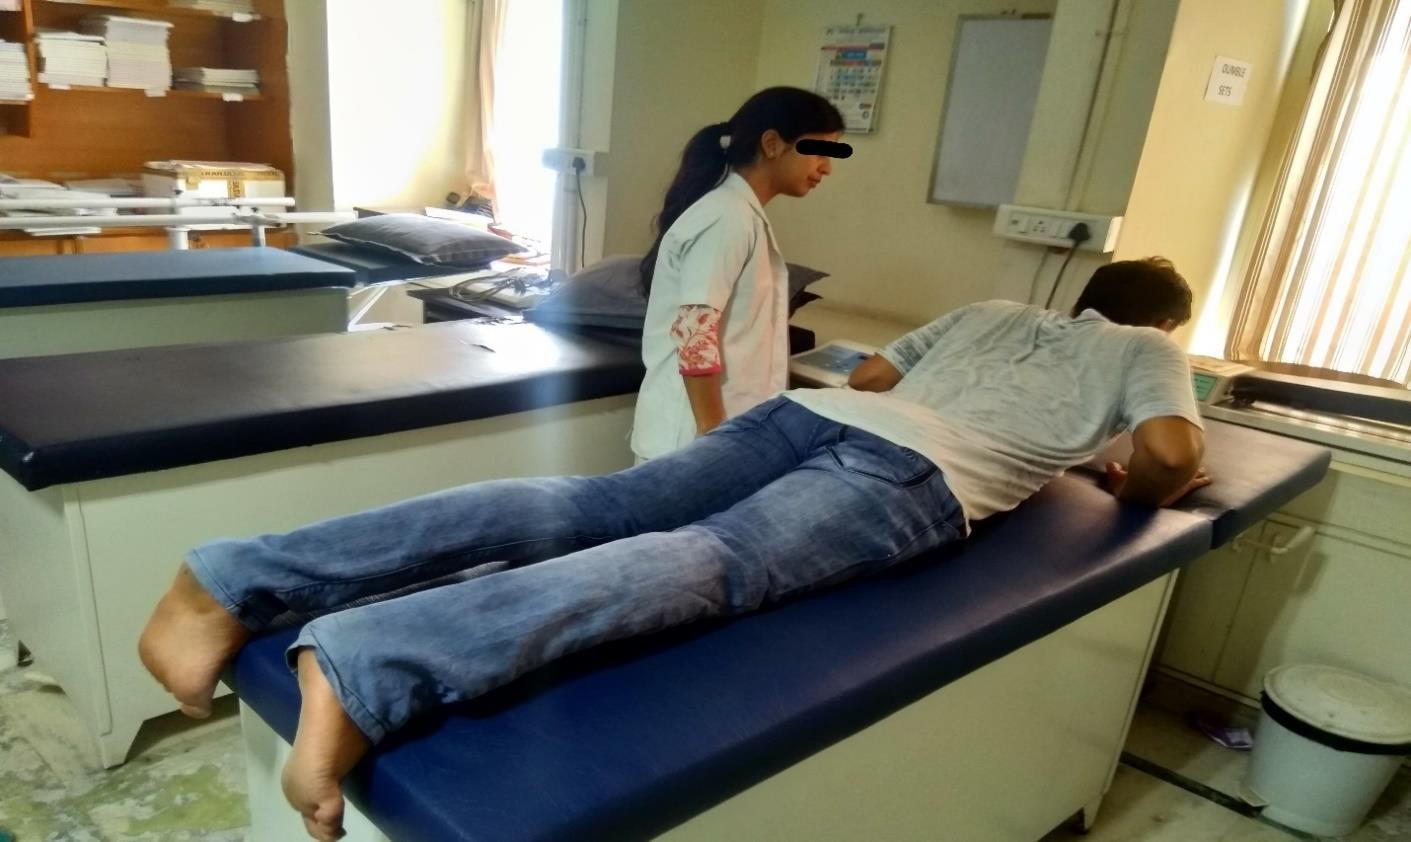
Figure No.4 McKenzie extension exercise
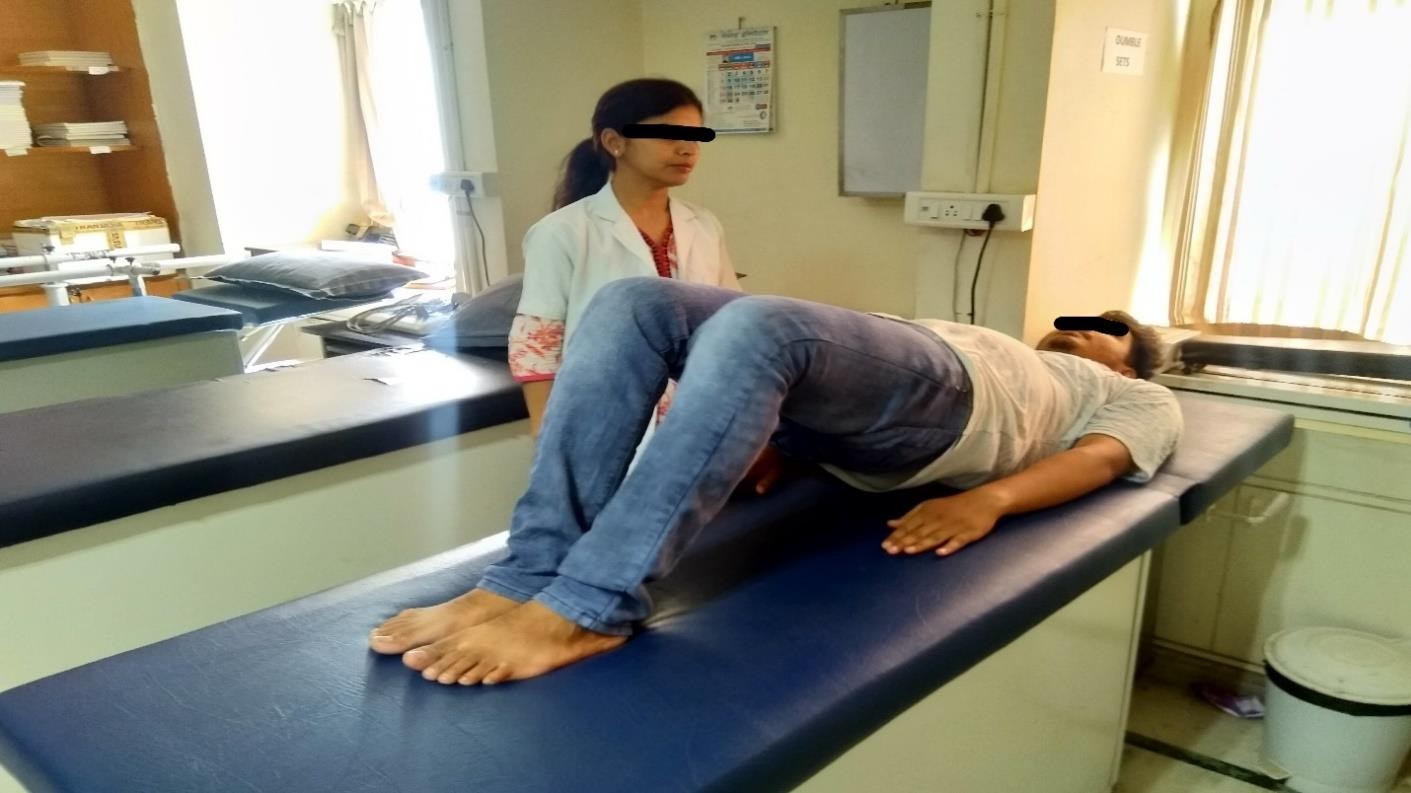
Figure No.5 Bridging exercise
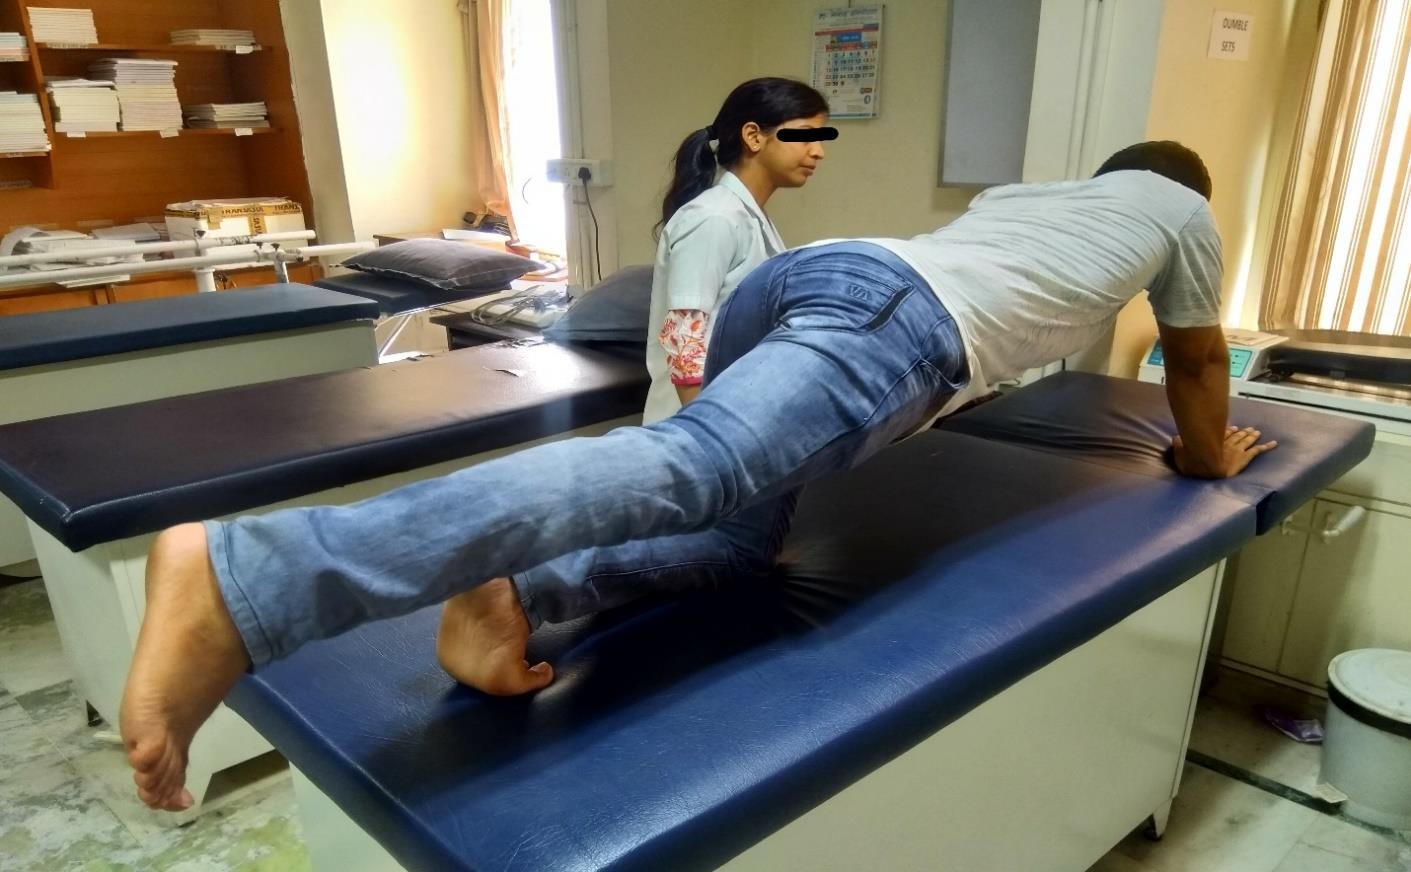
Figure No.6 Plank variation
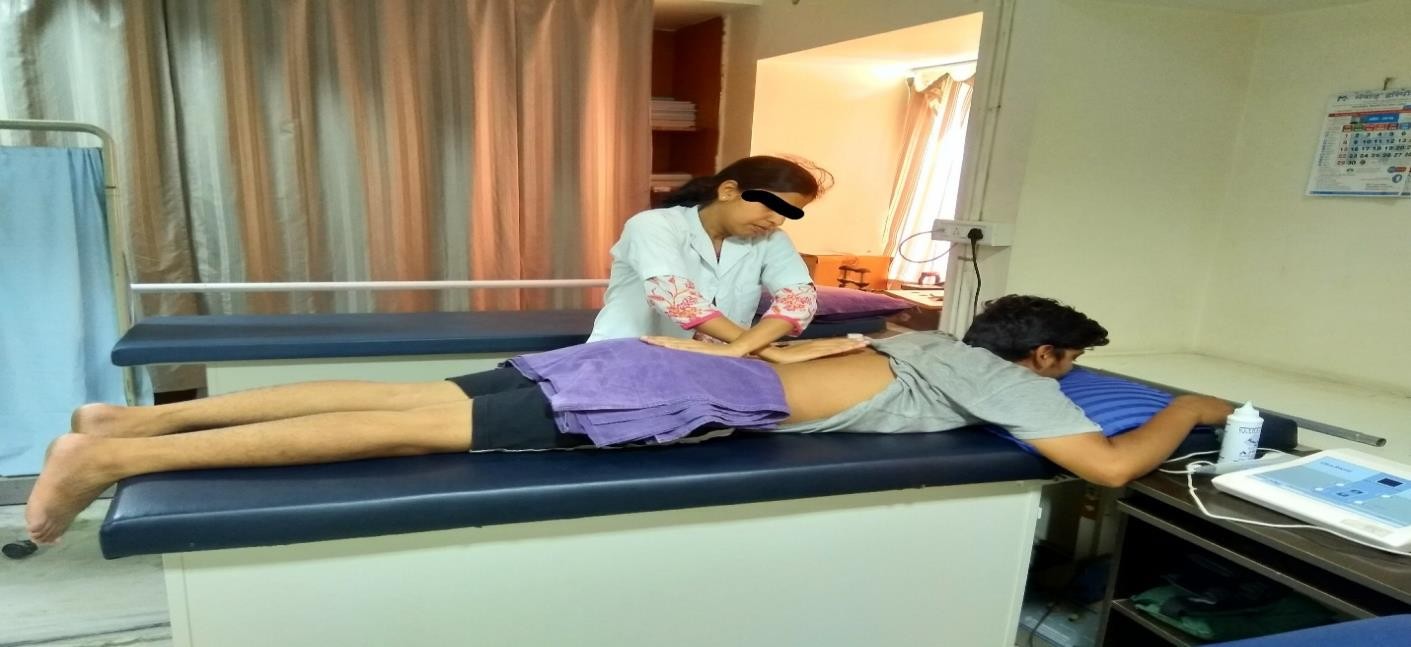
Figure No.7 Myofascial release technique
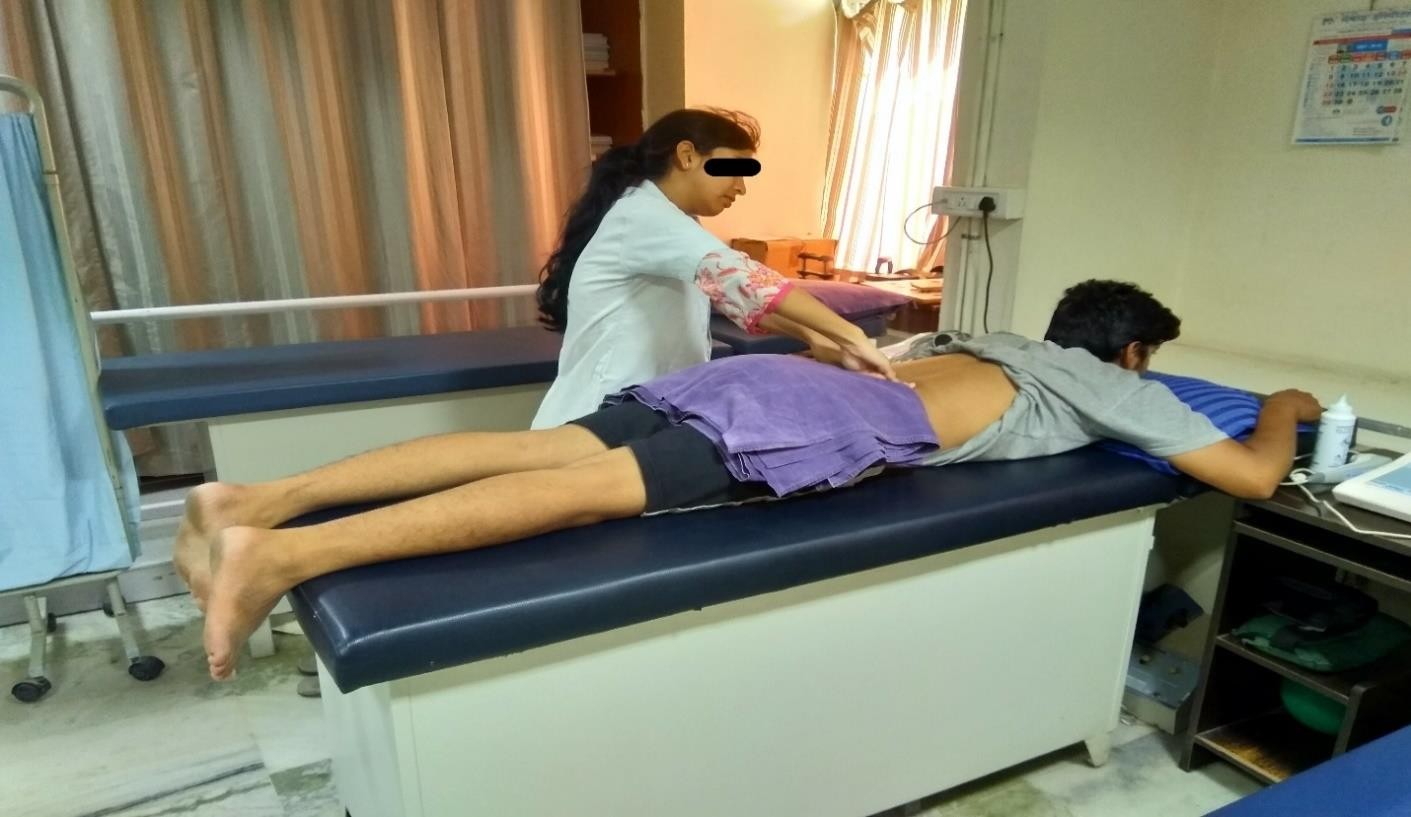
Figure No.8 Myofascial release technique
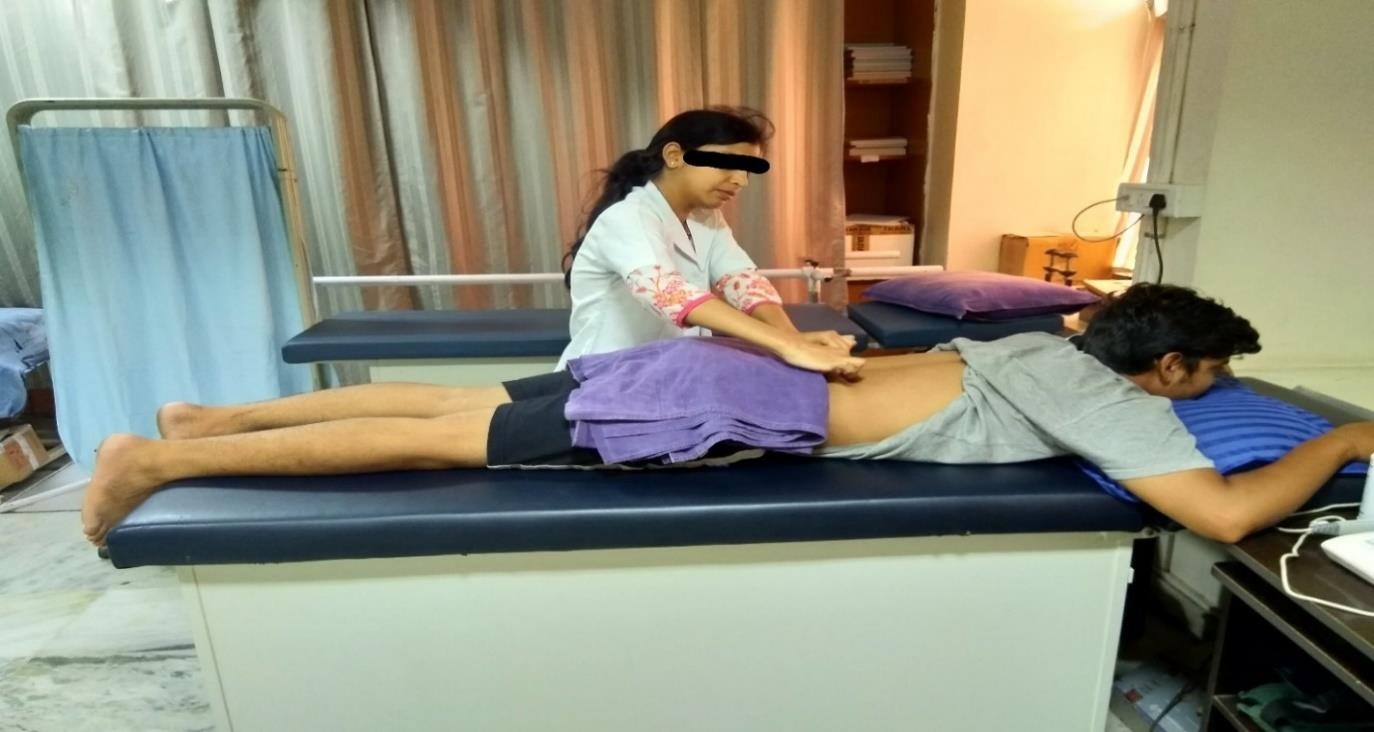
Figure No.9 Myofascial release technique
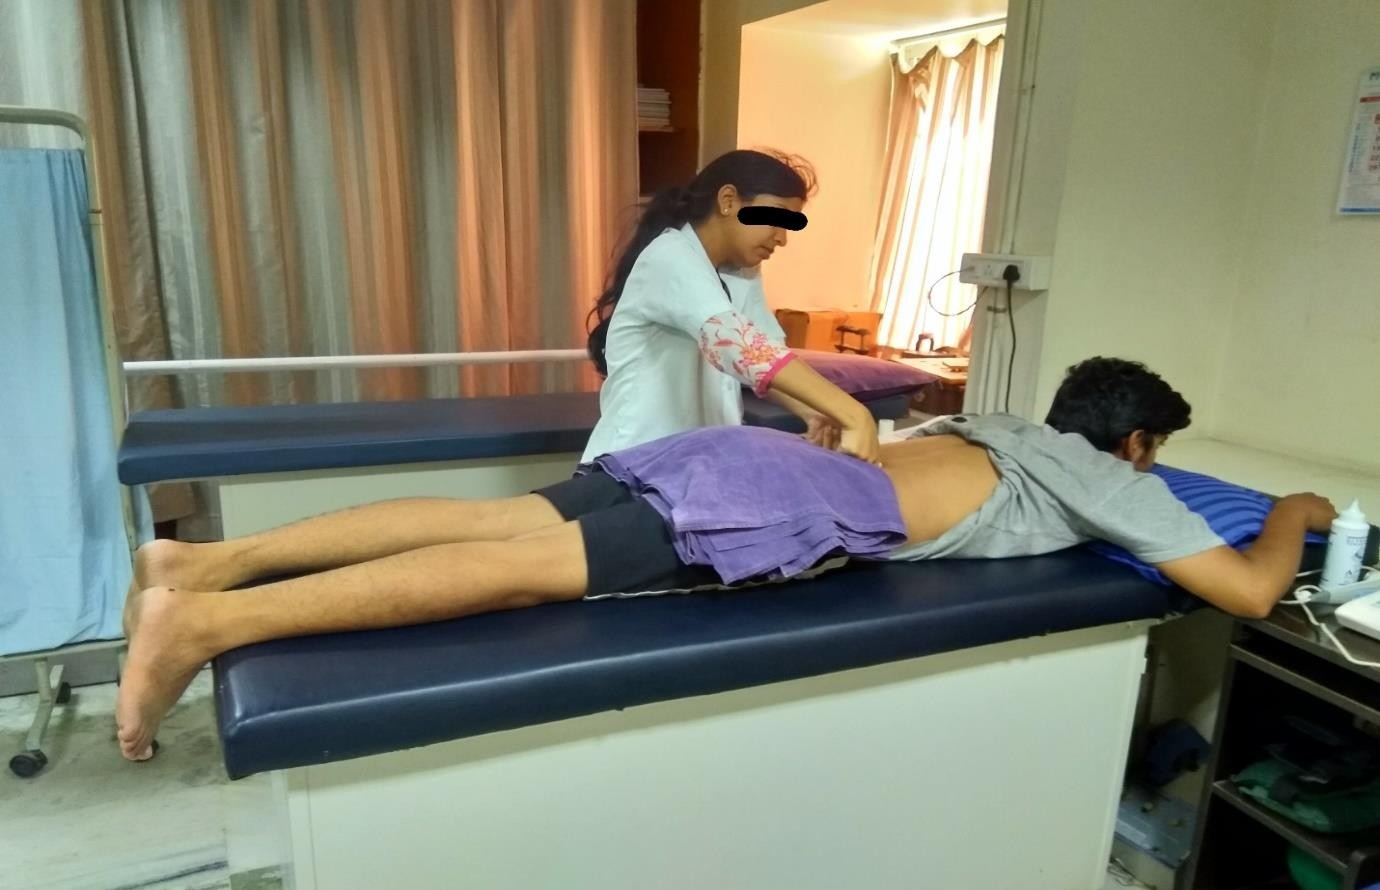
Figure No.10 Myofascial release technique
DATA ANALYSIS
Pre-test and post test data within group and between group well be analyses by paired and un paired ‘t’ test.
The differences between pre test and post test values were found the mean deference VAS of A compared with group B and the actual pattern of variation were observed.
With the ‘t’ value from the pre test and post test the accurate level of significance was analyses and interpreted.
An alpha level of p < 0.05 was the level of significant for the test Arithmetic mean: –
X̅ =∑x∕N Where,
X = Arithmetic mean
∑x= sum of all variables
N= total number of variables Standard deviation (s.d)
s.d= √(X-X̅ )2 /√N where,
x̅ = mean of scores
X = sum of all variable N = total no of variables (X-X̅ ) = deviation
Paired ‘t’ Test within group:
The paired ‘t’ test was used to find out the significance within the same group with the values of parameters considered for the study.
The formula to find the value of “t” using paired ‘t’ test:
t= [M1-M2]/SEMd
Where,
M1= Mean 1
M2= Mean 2
SEMd= Standard error of mean difference SEMd= √SEM12 + SEM22 – 2r SEM1 SEM2
r=correlation between GROUP A and GROUP B df=N-1
UNPAIRED ‘t’ TEST BETWEEN GROUP:
The ‘t’ test was used to find out the significance between the groups and it gives the variable information regarding this study.
The formula to find the value of ‘t’ using unpaired ‘t’ test for GROUP A via GROUP B: t=[M1-M2]/SEMd
where,
M1= Mean 1 M2 = mean 2
SEMd=Standard error of mean difference SEMd =√SEM12 +SEM22
SEM1 = Ꝺ1/√N1 SEM2= Ꝺ2/√N2
Demographic presentation of data in group
40 subject of age group 30-50 years were randomly selected according to inclusion and exclusion criteria and divided into two group with 20 subjects in each group. group A had a mean age of 38.6 years and group B had a mean age of 41.9 the demographic data of both the groups has been presented in table 5.1.
Table 5.1 demographic presentation of data in graph:
Age in year | ||||
Group | Number | Mean | S.D | |
Group A | 20 | 38.6 | 6.40 | |
Group B | 20 | 41.9 | 6.17 | |
Total | 40 | 40.25 | 6.506 | |
Demographic presentation of data in group
Graph
45
41.9
40
38.6
35
30
25
20
15
10
6.4
6.17
5
0
Group A
Group B
Group A Group B
Figure:5.1
Analysis of pre-test and port-test value of pain using visual analogue scale (VAS) for significance within Group A:
The pain score due to lumber disc prolapse of each subject in group A was assessed by using visual analogue scale (V.A.S) before the start of the treatment as pre-test values and at the end of 3rd month as post-test values the data has been presented in table and depicted in figure 5.2
Table:5.2 analysis of pre-test and post-test values of pain scores using visual analogue scale (VAS)
For significance within group A.
Mean | N | S.D | Std Error Mean | Mean Deference | T | P | Significance | |
Pre-test | 4.15 | 20 | 1.24 | 0.27 | ||||
VAS | 3.7 | 13.70 | 0.00002 | significant | ||||
Post-test | 0.45 | 20 | 0.49 | 0.11 |
Interpretation – the above table shows the mean of pre-test and post-test VAS values were 4.15 and 0.45 respectively. the mean improvement in pain scale of groups was 3.7 the ‘t’ value 13.70 and ‘p’ values 0.00002 for pain scores using VAS within group A analysis.
When compared to table value . the above ‘P’ value is lesser at p < 0.05 which is significant it indicate that group A treated with core exercises with Mckenzie method had less significant in pain intensity.
Analysis of pre-test and post test values of pain scores using visual analogue scale (VAS) for significance with group B:
The pain sore due to lumber disc prolapse of each subject in group B was assessed by using visual analogue scale (VAS) before the start of the treatment as pre-test values and at the end of 3rd month as post test value the data has been presented in table 5.3 and depicted in figure 5.3
Table 5.3 analysis of pre-test and post test values of pain scores using visual analogue scale (VAS) for significant within group B.
Mean | N | S.D | Std.Error Of Mean | Mean Difference | T | P | Significance | |
Pre-test | 3.55 | 20 | 1.68 | 0.375 | ||||
VAS | 3.15 | 7.5 | 0.00003 | significant | ||||
Post-test | 0.4 | 10 | 0.48 | 0.107 |
Interpretation – the above table shows the mean of pre-test and post-test VAS values were 3.55 and 0.4 respectively the mean improvement in pain score group b was 3.15 the ‘t’ value 7.5 and ‘P’ value 0.00003 for pain score using VAS within group B analysis when compared to table value , the above ‘p’ value is lesser at p<0.05 which is significant. It indicates that group B treated with core exercise with MFR had significant improvement effect in pain intensity .
Fig 5.2 . analysis of pre-test and post-test values of pain scores using visual analogue scale (VAS) for significant within group A.
Chart Title
4.5
4.15
4
3.5
3
2.5
2
1.5
1.24
1
0.45 0.49
0.5
0
pre-test
post-test
Series 1 Series 2
Figure 5.3 analysis of pre-test and post-test values of pain scores using visual analogue scale (VAS) for significant within Group B
Chart Title
4
3.55
3.5
3
2.5
2
1.5
1
0.5
0
Pre-test
Post-test
Series 1 Series 2
1.68 | 0.4 0.48 | |||||
Analysis of Pre-test values of pain scores using VAS of lumber disc proper between group
The pain score of lumber disc prolapse of each subject in group A and group B were assessed by using visual analogue scale (VAS) before the start of the treatment as pre-test values .the values of group A & group B were compared between groups for significance of treatment the data has been presented in table 5.4.
Tables 5.4 Analysis of pre-test values of pain scores using VAS for significance between group.
Group | Mean | N | S.D | Std Error Of Mean | Mean Deference | T | P | Significance | |
VAS | A | 4.15 | 20 | 1.24 | 0.27 | ||||
0.60 | 3.7 | 0.000062 | significant | ||||||
Pre-test | B | 3.55 | 20 | 1.68 | 0.375 |
Interpretation
The above table shows the mean of free test values of pain scores were 4.15 and 3.55 in group A and group B respectively .the mean deference in pain scores between group were 0.60 . the ‘t’ value 3.7 and ‘P’ value 0.00062 for pain scores of lumbar disc prolapse between group a and group B analysis when compared the table value the above ‘P’ value is lesser at p < 0.05 which is significant ,
Analysis of post-test values of pain scores using VAS of lumbar disc prolapse between groups.
The pain scores of lumbar disc prolapse of each subject in group a and group b were assist by using VAS at the end of third month as post-test values. The value of group a and group b were compared between group for significance of treatments .
Analysis of post test values of pain scores using VAS for significance between groups
Group | Mean | N | S.D | Std.Error Mean | Mean Deff. | T | P | Significance | |
VAS Post- Test | A | 0.45 | 20 | 0.49 | 0.11 | ||||
0.05 | 0.32 2 | 0.016 | Non- Significant | ||||||
B | 0.4 | 20 | 0.48 | 0.105 |
Interpretation the above table show the post-test value for group a and group b of mean 0.45 and 0.4 respectively and ‘t’ value 0.322 for pain score using VAS between groups. When compared to table value, the above p value is 0.016 at p < 0.05, which is greater it indicates that technique were effective in lumber disc prolapse but the group A treated with core exercises with Mckenzie method has less effect then group B treated with core exercise MFR in subjects
Mean improvement in all the parameter between group A and group B
The pain score of each subject in group A and group B were assessed by using VAS before the start of the treatment and at the end of third month the mean improvement in pain score were compared between both the group.
Group | No | Age In Years | |
Mean | S.D | ||
Group A | 20 | 38.6 | 6.40 |
Group B | 20 | 41.9 | 6.17 |
Total | 40 | 40.25 | 6.506 |
Within group:
Group A
Mean | N | S.D | Std.Error Mean | Mean Difference | T | P | |
Pre-Test | 4.15 | 20 | 1.24 | 0.27 | |||
Vas | 3.7 | 13.70 | 0.00002 | ||||
Post-Test | 0.45 | 20 | 0.49 | 0.11 |
Group B
Mean | N | S.D | Std.Error Mean | Mean Deference | T | P | |
Pre-test | 3.55 | 20 | 1.68 | 0.375 | |||
vas | 3.15 | 7.5 | 0.00003 | ||||
Post-test | 0.40 | 20 | 0.48 | 0.107 |
Between the group Group A
Mean | N | S.D | Std.Error Mean | Mean Deference | T | P | |
Pre-test | 4.15 | 20 | 1.24 | 0.27 | |||
vas | 0.60 | 3.7 | 0.000062 | ||||
Post-test | 3.55 | 20 | 1.68 | 0.375 |
Group B
Mean | N | S.D | Std.Error Mean | Mean Deference | T | P | |
Pre-test | 0.45 | 20 | 0.49 | 0.11 | |||
vas | 0.05 | 0.322 | 0.0161 | ||||
Post-test | 0.4 | 20 | 0.48 | 0.105 |
Parameters | Group A | Group B |
Pain(VAS) | 3.7 | 3.15 |
Interpretation
The above table shows the mean improvement in pain scores of VAS was 3.7 in group A and
3.15 in group B it was resulted that group A treated with core exercises with McKenzie method had a less effect in pain score over group B treated with core exercises with MFR in lumber disc prolapse in subjects.
RESULTS
This study concluded that core exercises with MFR had effective tool in lumbar disc prolapse stage 2 patients as reliving pain. While comparing with core exercises with McKenzie method.
DISCUSSION
Lumbar disc herniation is the most common diagnosis among the degenerative abnormalities of the lumber spine (effecting 2 to 3 percent of population) Greater risk of disc herniation has been attributed to smoking and exposure to repetitive loads and prolonged vibration. Conservative treatment is effective in 80% of patient with in 4 to 6 week.
Intervertebral discs can prolapse suddenly because of excessive pressure, examples include:
- Falling from a significant height and landing on your buttocks. This can transmit significant force across the spine. If the force is strong enough ether a vertebra can fracture, or an intervertebral disc can rupture.
- Banding forces places substantial stress on the vertebral discs. If you band and attempt to lift an object which is too heavy this force may cause a disc to rupture.
Intervertebral discs can also rupture as a result of weakening outer fibers of the disc. This is usually due to repetitive minor injuries build up over time. This damage may occur with aging, hereditary factors, work or recreation related activities.
A prolapsed disc can cause problem in two ways:
- Direct pressure – the disc material that has ruptured into the spinal canal or intervertebral foramen can put pressure on the nerves
- Chemical irritation – once ruptured, the core material of the disc can cause a chemical irritation of nerves roots and result in inflammation of the nerves.
In this study lumbar disc stage-2 patients were categories into 2 groups and one group treated with core exercises plus MFR method and other group treated with Mckenzie method plus MFR (myofascial release technique) various scale used to measure pain and statistical test used to interpret the data. This study shows that the core exercises plus MFR (myofascial release technique) has effective results on patients.
During myofascial release therapy the therapist locates myofascial areas that feel stiff and fixed instead of elastic and movable under light manual pressure these area, through not always near what feels like the source of pain are through to restrict muscle and joint movements, which contributes to wide spread muscle pain the focused manual pressure and stretching used in myofascial release therapy loosen up restricted movement, leading indirectly to reduced pain. In addition to core exercises it strengthen the back, as weak back leads to pain.
When core muscles are in poor condition, additional stress is applied to the spine as it supports the body, and back injury or back pain is more likely. Without specific back and abdominal exercises to target these muscles, they will naturally weaken over time, increasing the chance of developing or worsening back pain. Strong core muscles reduce the likelihood of back pain
episodes, reduce severity of back pain, improve posture, protect against injury by responding efficiently to stresses.
So core exercises with MFR techniques have effective results on patient. While other methods have no more effective on patients, because in MFR focused manual pressure loosen up restricted movements and core exercises strengthen the back muscles which reduce the pain. While other method not directly loose restricted movements and strengthen back.
Mckenzie method is a common intervention for patient with prolapse intervertebral disc.
Although this intervention sequence is effective but recurrence of symptoms is common, addition of core stabilization exercises will definitely give a permanent stability to disc thus reducing chances of recurrence.
Mckenzie with core strengthening exercises reduced pain improve strength, range of motion and reduces disability in P.I.V.D subjects.
The Mckezie method is successful with treating acute low back pain it is also very helpful for those patients with sub-acute and chronic back pain.
One of the benefits of the Mckenzie method is that it is a standardized approach to both the assessment and treatment of low back pain. The Mckenzie method is not simply a set of exercises; it is a defined algorithm that serves to classify the spinal problem so that it can be adequately treated. The Mckenzie method is grounded in findings a cause and effect relationship between the positions the patient usually assumes while sitting standing or moving and the generation of pain as a result of those positions or activities. The therapeutic approach requires a patient to move through a series of activities and test movements to gauge the patient’s pain response. The approach then uses that information to develop an exercise protocol designed to centralize or alleviate the pain.
Myofascial release (MFR) is a form of manual therapy that involves the application of a low load, long duration stretch to the myofascial complex, intended to restore optimal length, decrease pain and improve function.
Myofascial relese can help increase lymph and venous flow to promote the removal of exudates after an injury.
MFR therapy focuses on releasing muscular shortness and tightness many patient seek myofascial treatment after losing flexibility or function following an injury or if experiencing ongoing back, shoulder, hip or virtually pain in an area containing soft tissue.
CONCLUSION
The study on patients with stage-2 lumbar disc prolapse conclude that MFR (myofascial release technique) along with core exercises is more effective in alleviating primary symptoms of pain thus enhancing the functional capabilities of the patients.
LIMITATIONS AND RECOMMENDATION
Limitation
- duration of study is 3 months
- Study was undertaken for small sample size
Recommendation
- duration of study should be more
- Study should be taken for large sample size
REFERENCES
- Coulehan JL (1985) Adjustment, the hands and healing.Cult Med Psychiatry 9: 353- 382.
- Miller JK (1992) TheMcKenzie Approach. ClinOrthop 279: 8-20.
- Meszaros TF, Olson R, Kulig K, Creighton D, Czarnecki E (2000) Effect of 10%, 30%, and 60% body weight traction on the straight leg raise test of symptomatic patients with low back pain.J Orthop Sports PhysTher 30: 595-601.
- Wieting JM (2005) Massage, Traction, and Manipulation. Medscape.
- Werners R, Pynsent PB, Bulstrode CJ (1999) Randomised trial comparing interferential therapy with motorized lumbar traction and massage in management of low back pain in a primary care setting. Spine (Phila Pa 1976) 24: 1579-1581.
- Armstrong JR (1965) Lumbar disc lesions, (3rd edtn). Williams and Wilkins, Edinburgh, Livingstone.
- McKenzie RA (1981) The lumbar spine. Mechanical diagnosis and therapy. Spinal publications, Waikanae, NewZealand.
- Youssef J, Davidson B, Zhou BH, Lu Y, Patel V, et al. (2008) Neuromuscular neutral zones response to static lumbar flexion: Muscular stability compensator. ClinBiomech (Bristol, Avon) 23: 870-880.
- Laslett M (2009) Manual correction of an acute lumbar lateral shift: maintenance of correction and rehabilitation: a case report with video.J Man ManipTher 17: 78-85.
- McGill SM, Kippers V (1994) Transfer of loads between lumbar tissues during flexion- relaxation phenomenon. Spine (Phila Pa 1976) 19: 2190-2196.
- McKenzie RA (1972) Manual correction of sciatic scoliosis.N Z Med J 76: 194-199.
- Carroll LJ, Cassidy JD, cote P (2000) the Saskatchewan Health and Back Pain Survey: the prevalence and factors associated with depressive symptomatology in Saskatchewan adults. Can J Public Health 91: 459-464.Philadelphia Panel (2001)
- Philadelphia Panel Evidence-Based Clinical Practice Guidelines on Selected Rehabilitation Interventions for Low Back Pain. Phys Ther 81: 1641-1674.
- McKenzie RA, May S (2003) The Lumber Spine: Mechanical Diagnosis and Therapy (2nd edtn). Spinal Publications, Waikanae, New Zealand. Pellecchia GL (1994) Lumbar traction: a review of the literature.j Orthop Spotd Phys Ther 20: 262-267 Murrin KR, Rosen M (1985) Pain measurement, In: Smith G and Govindo BG (editors) Acute Pain: London: Butterworth.
- Kremer E, Atkinson JH, lgnelzi RJ (1981) measurement of Pain: Patient preference does not confound pain measurement.Pain 10:241-248.
- Revill Sl,Robinson JO, Rosen M, Hogg MI (1976) the reliability of a linear analogue for evaluating pain. Anaesthesia 31: 1191-1198.
- Vianin M (2008) Psychometric properties and clinical usefulness of the Oswestry Disability index. J Chiropr Med 7:161-163.
- Gordon SJ, Kish VL, et al. (1991) Mechanism of disc rupture. A preliminary report. Spine (Phila Pa 1976) 16: 450-456. Veres SP, Robertson PA, Broom ND (2008) ISSLS prize winner: Microstructure and mechanical disruption of the lumbar disc annulus:
- part II: how the annulus fails under hydrostatic pressure. Spine (Phila pa 1976) 33: 2711-2720.
- Donelson R, Aprill C, Medcalf R, Grant W (1997) A prospective study of centralization of lumbar and referred pain. A predictor of symptomatic discs and anular competence. Spine (Phila Pa 1976) 22: 1115-1122.
- Adams MA, May S, Freeman BJ, Morrison HP, Dolan P (2000) effects of backward bending on lumbar intervertebral disc. Relevance to physical therapy treatment for low back pain. Spine (phila pa 1976) 25: 431-437.
- Santolin SM (2003) McKenzie diagnosis and therapy in the evaluation and management of a lumbar disc derangement syndrome: A case study.J Chiropr Med 2: 60-65.
- Key JA, Ford LT (1948) Experimental intervertebral-disc lesions.J Bone Joint Surg Am 30A: 621-630.
- Melbye M (2010) An adherent nerve root–classification and exercise therapy in a patient diagnosed with lumbar disc prolapse.Man Ther 15: 126-129.
- Alfredson H, Pietilä T, Jonsson P, Lorentzon R (1998) Heavy-load eccentric calf muscle training for the treatment of chronic Achilles tendinosis.Am J Sports Med 26: 360-366.
- Langberg H, Ellingsgaard H, Madsen T, Jansson J, Magnusson SP, et al. (2007) Eccentric rehabilitation exercise increases pe.
- John F.barnes,Pediatrics Myofascial release,Physical therapy forum- MRF techniques 1991
- Carol manhiann 2001.the myofascial release manual,3rd edition slack inc.
- Regi boehme,john boehme , myofascial release and its application to neuro development treatment 1991,page no.5-8,11-16,80.
- Keith Grant and Art Riggs. Modalities for massage and bodywork; Myofascial release; published by Massage Therapy Foundation 2005
- Wadell G. The back pain revolution, 2nd ed. Edinburg: Chruchill Livingstone, 2004:74
- Craig E. Morris, Low Back Syndromes,©2006,Epidemology of low back syndromes, pg 87
- Woolf A, Pfleger B. Burden of major musculoskeletal conditions. Bull World Health
- Laura Punnett, Sc.D. et al. Estimating the global burden low back pain attributable to combined occupational exposures. American journal of industrial medicine,2005 dec;48(6):459-64
- AK Burton F;Balagué et al. European guidelines for management in low back pain; Eur Spine J. 2006 Mar;15Suppl 2:S136-68.
- Gordon Wadell. Nonorganic physical signs in low back pain;vol- 5(2),march/april 1980
- Andersson GBJ. The epidemiology of spinal disorders. The adult spine: principles and practice. 2nd ed. New York: Raven Press, 1997: 93- 141.
- Van Tulder MW, Koes BW, Bouter LM. Conservative treatment of acute and chronic non-specific low back pain: a systematic review of randomized controlled trials of the most common interventions. Spine 1997; 22:2128-2156.
- Travis Whitfill et al. Early Intervention Options for Acute Low Back Pain Patients:A Randomized Clinical Trial with One-Year Follow-Up Outcomes; J OccupRehabil (2010) 20:256–263
- Pengel LH, Herbert RD, Maher CG, Refshauge KM. Acute low back pain: Systematic review of its prognosis. BMJ2003;327:323
- EdaGurcay et al. Acute LBP course and prognosis. Disability and Rehabilitation, 2009; 31(10): 840–845
- Christopher A Mayor; A meta analysis of massage therapy research. Psychological Bulletin Copyright 2004 by the American Psychological Association, Inc; 2004, Vol. 130, No. 1, 3–18.
- Manheim, C.J. The Myofascial Release Manual, third ed.Slack Incorporated, New Jersey, USA, 2001
- Robert Schleip. Fascial plasticity- a new neurobiological explanation: part 1; journal of bodywork and movement therapies(2003) 7(1), 11- 19.
- Paoloni J et al. Review of myofascial release as effective massage therapy technique; Athletic Therapy Today,2009,Sep;14(5):30-34
- The fascial network: an exploration of its load bearing capacity and its potential role as a pain generator, Robert Schleip, Fascia Research Project, Institute of Applied Physiology, Ulm University, Ulm, Germany
- Norkin C.C, Levangie PK, Joint structure and function, 4thed, Jaypee brothers medical publication, 2006
- I A Kapanji. The physiology of joints;2nd edition vol-3; Edinburg London &New York 1974
- John Barnes, PT. Myofascial release approach: part 1; massage magazine, dec 2006.
- Pathophysiology of pain and pain assessment. American medical association©2010
- Craig E. Morris, Low Back Syndromes, ,Myofascial release in low back syndromes,©2006 pg 243-276
- Panjabi MM 2006 A hypothesis of chronic low back pain: ligament subfailure injuries lea to muscle control dysfunction; Eur spine J 15(5): 668-76
- Schleip R, et al. 2007 Letter to the Editor concerning “A hypothesis of chronic backpain: ligament subfailure injuries lead to muscle control dysfunction” (M.Panjabi). Eur Spine J 16: 1733-35
- Paolo Tozzi.Fascial release effects on patients with non-specific cervical or lumbar pain; Journal of Bodywork & Movement Therapies (2011) 15, 405e416
- Taguchi, T., et al. The thoracolumbar fascia as a source of low back pain. In P.A. Huijing et al. (Eds.), Fascia ResearchII: Basic Science and Implications for Conventional and Complementary Health Care. Munich, Germany: Elsevier 2009
- Lieutenant Colonel Joseph R. et al. The effects of spinal flexion and extension exercises and their associated postures in patients with acute low back pain;Spine J vol20, no.21. pg 2303-2312.
- Michael Vianin DC. Psychometric properties and clinical usefulness of the Oswestry Disability Index;; Journal of Chiropractic Medicine (2008) 7, 161–163 Pedretti L W, Occupational therapy practice skills for physical dysfunction, 4thed, 1996, pg 87-88.
- Danniel&Worthighams, Techniques of manual examination, 6th edition
- Marshall P. W., Murphy BA. Evaluation and neuromuscular changes after exercises rehabilitation for low back using a swiss ball: a pilot study. Journal of Manipulative physiotherapy, 2006 sept, 29 (7) 550- 560
- D. J. L. Kuh. Height, occupation and back pain in a national prospective study; British Journal of Rheumatology 1993;32:911-916
- Michael Pfingsten. Fear avoidance behavior and anticipation of pain in patients with chronic low back pain;
- Jonathan R Field1*, Field et al. Preliminary study into the components of the fear- avoidance model of LBP: change after aninitial chiropractic visit and influence on outcome. Chiropractic & Osteopathy 2010, 18:21
- Swinkels-Meewisse IE. Fear-avoidance beliefs, disability, and participation in workers and non-workers with acute low back pain;Clin J Pain. 2006 Jan;22(1):45-54
- Hernandez-Reif M. Lower back pain is reduced and range of motion increased after massage therapy; Int J Neurosci. 2001;106(3-4):131- 45.
- Rose Adams. The Effects of Massage Therapy on Pain Management in the Acute Care Setting; Int J Ther Massage Bodywork. 2010; 3(1): 4– 11.
- Paul Dolder et al. A trial into the effectiveness of soft tissue massage in the treatment of shoulder pain;; Australian journal of physiotherapy 49: 183-188.
- www.pubmed.com
- www.google.com
LIST OF ABBREVIATION
V.A.S – VISUAL ANALOGUE SCALE
M.M.T – MANUAL MUSCLE TESTING
O.Q.D – OSWESTRY DISABILITY QUESTIONNAIRE
M.F.R – MYOFASCIAL RELEASE
A COMPARATIVE STUDY ON EFFECTIVENESS OF MOTOR IMAGINARY TECHNIQUE ON IMPROVING UPPER LIMB FUNCTION IN MIDDLE CEREBRAL ARTERY STROKE
Dr. Navjyoty, MPT Neuro, Dr. Divya Tiwari, MPT Cardio
ABSTRACT
STUDY OBJECTIVES: The effectiveness of motor imaginary technique in middle cerebral artery stroke .
DESIGN: Pre-test and post-test two group experimental study design. PARTICIPANTS: Thirty subjects aged 40-55 years with middle cerebral artery stroke patients were selected under purposive sampling technique and assigned in to two groups with 15 subjects each,one group received conventional physiotherapy and other group received conventional physiotherapy with motor imaginary technique for a period of 4weeks
INTERVENTION: Motor imaginary technique is given to middle cerebral artery stroke patients for 20 minutes per session twice a week .
OUTCOME MEASURES: Fugl-meyer scale is to measure functional outcome before and after treatment
RESULT: Patients in experimental group shows significantly better performance than control group.
CONCLUSION: It can be concluded that motor imaginary technique is a promising intervention for improving functional activity of affected upper limb in middle cerebral artery patients.
CONTENTS
S.NO. | TITLE | PAGE NO. |
I | INTRODUCTION | |
1.1 Introduction | 01 | |
1.2 Need for the study | 04 | |
1.3 Operational definition | 05 | |
1.4 Aims & Objectives | 06 | |
1.5 Hypothesis | 07 | |
II | REVIEW OF LITERATURE | 08 |
III | MATERIALS AND METHODOLOGY
| |
12 | ||
12 | ||
12 | ||
12 | ||
12 | ||
13 | ||
13 | ||
13 | ||
14 | ||
14 | ||
14 | ||
14 | ||
15 | ||
16 | ||
18 |
IV | DATA PRESENTATION | 19 |
V | DATA ANALTSIS AND INTERPRETATION | 21 |
VI | RESULTS | 29 |
VII | DISCUSSION | 31 |
VIII | SUMMARY AND CONCLUSION | 33 |
IX | LIMITATIONS AND SUGGESTIONS | 34 |
X | BIBLIOGRAPHY | 35 |
XI | REFERENCE | 37 |
XII | APPENDIX | 39 |
APPENDIX I | 39 | |
APPENDIX II | 40 | |
APPENDIX III | 42 |
LIST OF GRAPHS
Graph No | Content | Page No |
1 | Pre-test values of control group and experimental group | 22 |
2 | Post-test values of control group and experimental group | 24 |
3 | Pre-test and post-test values of control group | 26 |
4 | Pre-test and post-test values of experimental group | 28 |
LIST OF TABLES
Table No. | Content | Page No |
1 | Analysis of pre-test values of control and experimental group | 21 |
2 | Analysis of post-test values of control and experimental group | 23 |
3 | Analysis of pre-test and post –test values of control group | 25 |
4 | Analysis of pre-test and post-test values of experimental group | 27 |
INTRODUCTION
Brain is the major organ of the central nervous system that has control center for all the body’s voluntary and involuntary activities. The brain has high energy requirement and little metabolic reserves. Interruption of blood flow only few minutes sets in motion a series of pathological events and damage to brain tissue.
Stroke (or) cerebrovascular accident is defined as a rapidly developing clinical sign of focal (or) global disturbance of cerebral function lasting more than 2 hours (or) leading to death with no apparent cause other than the vascular origin (WHO 1991) (Susan B.O Sullivan 2009).
A stroke is a brain attack. It is a third leading cause of death. It occurs when blood clot or ruptured vessel prevent oxygen from reaching the brain resulting in destruction of brain cells.
The disturbance of cerebral function is caused by 3 morphological abnormalities, i.e. stenosis, occlusion or rupture of the arteries. Dysfunction of the brain (neurological deficit) manifests itself by various neurological signs and symptoms that are related to the extent and site of the area involved and to the underlying causes.
Warning signs of stroke can be numbness, weakness or paralysis of face, arm, and leg especially on one side of the body sudden severe head ache, loss of balance and many factor contribute to delay in seeking medical treatment for stroke.
It has been noted that stroke incidence may vary considerably from country to country. The prevalence of stroke in India was estimated as 203 per 100,000 population above 20 years, amounting to a total of about 1 million cases (Sethi .K). 78 per cent of strokes in 40 – 65 age group (M.Dinesh Varma).In south India it was reported to be 56.9 per 100,000 as compared to 150 to 100,00 for USA and EUROPE.
The major modifiable risk factor for stroke are transient ischemic attacks especially in presence of 70-99% carotid artery stenosis, hypertension, arterial fibrillation or other source of cardiac emboli, left ventricular hypertrophy, congestive heart failure, cigarette smoking, alcohol consumption, cocaine use, obesity, diabetes mellitus, high serum cholesterol and non modifiable risk factor are age, race, gender and family history of stroke.
Middle cerebral artery occlusion is more common site of occlusion in ischemic stroke. Post stroke hemi paralysis in middle cerebral artery syndrome leads to impairment of upper extremity functions more than the lower extremity. Early activation and forced use of involved upper extremity is effective in counter balancing this effect.
The recovery from stroke takes place in initial 3-6 months after the attack (UMPHERD, 1998) however, research has shown there can be recovery of useful motor function year’s later.
Physiotherapeutic measure on Stroke has been revolutionized in the last decade through a combination of new techniques looking at brain recovery. Advances in basic sciences and clinical research are beginning to merge and show that the human brain is capable of significant recovery after stroke, provided that the appropriate treatments and stimuli are applied in adequate amounts and at the right time. To improve functional activity there is a challenge to implement newer techniques, in that motor imaginary technique shows an important role.
Naturally the challenge in managing middle cerebral artery is to improving functional activity. Physiotherapy with it recent literatures are designing a newer or comprehensive techniques to improve the functional activity of middle cerebral artery stroke.
In that way , one or more recent advancing research on motor imaginary plays vital role on improving Upper limb function of middle cerebral artery stroke which also need more research work.This study may be useful for physiotherapist who is treating these subjects and future reference for practicing physiotherapy.
NEED FOR THE STUDY
Cerebro vascular accident is among the most frequent of all neurological disorder.
The major goal of stroke rehabilitation is functional enhancement by maximizing the independence, life style, and dignity of the patient.
The mortality due to stroke is very severe. Owing to high incidence of middle cerebral artery stroke, upper limb is severely affected than lower limb. About 20% of individual paralyzed by stroke fail to regain the functional use of affected limb, Physiotherapy techniques and approaches improves functional activity following stroke traditionally.
In recent advances shows that motor imaginary technique will play a role on improving upper limb function in stroke.
There has been very few research which supports on motor imaginary technique and its role on upper limb function in stroke. In stoke especially in middle cerebral artery involvement attacks the upper limb function mostly. So there is need to do further study on motor imaginary technique on improving functional activity of upper extremity in middle cerebral artery stroke.
OPERATIONAL DEFINITIONS
Stroke
“Rapidly developed clinical sign of focal (or) global disturbance of cerebral function lasting more than 24 hours or leading to death with apparent cause other than vascular origin”
-WHO (1996)
Hemiplegia
Motor defects are characterized by paralysis (hemiplegic) or weakness (hemi paresis) typically on one side of the body opposite to side of lesion.
– Susan B.Sullivan(1996)
Fugl-Meyer scale
It is an impairment based test with items organized by sequential recovery stage. A three point ordinal scale is used to measure Impairments of volitional movement with grades from 0 to 2 with sub test for upper extremity function, lower extremity function, balance, sensation, pain and range of motion.
– Brunnstorm(1987)
Motor imaginary technique
Motor imaginary refers to the active process by which humans experience sensations with or without external stimuli. It is an active process during which a specific action is reproduced with in working memory without any real movements
-jeannerod(2006)
AIMS AND OBJECTIVES
AIM OF THE STUDY
The aim of the study is to find out the effectiveness of motor
imaginary technique on improving upper limb function in middle cerebral artery stroke.
OBJECTIVE OF THE STUDY
To study the effectiveness of conventional physiotherapy on improving upper limb function in middle cerebral artery.
To study the effectiveness of conventional physiotherapy with motor imaginary technique on improving upper limb function in middle cerebral artery.
To compare the effectiveness of conventional physiotherapy and conventional physiotherapy with Motor imaginary technique on improving upper limb function in middle cerebral artery.
HYPOTHESIS
Null Hypothesis
There is no significant difference between conventional
physiotherapy and conventional physiotherapy with motor imaginary technique on improving upper limb function in middle cerebral artery stroke.
Alternative Hypothesis
There is significant difference between conventional physiotherapy and conventional physiotherapy with motor imaginary technique on improving upper limb function in middle cerebral artery stroke.
MATERIALS AND METHODOLOGY
MATERIALS
-
-
- Table
- Pillows
- Ice
- Chair
- Towel
- Couch
- Peg board
- Needle and thread
- Audio tape
-
METHODOLOGY
Study Design
Pre-test, post-test two group Experimental study design
Sampling design
Purposive sampling technique.
Population
The sample size consist of 30 subjects with middle cerebral artery stroke were selected assigned in to control group and experimental group.
Control group:
consist of 15 middle cerebral artery stroke subjects treated with conventional physiotherapy .
Experimental group:
consist of 15 middle cerebral artery stroke subjects treated with conventional physiotherapy and motor imaginary physiotherapy technique.
Sample
30 subjects who fulfilled inclusion and exclusion criteria were selected for
the study.
Criteria for selection of subjects Inclusion criteria
-
-
-
- Ability to walk indoor without a stick indicating no major balance problem
- Hemi paretic patient within the involvement of middle cerebral artery.
- Above one month post-stroke and within one year.(Brunnstorm stage 2)
- Ischemic type of stroke.
- Age groups between 40-55 years
- Both gender
- Both sides of involvement
-
-
Exclusion criteria
-
-
-
- Serious sensory or cognitive and aphasic deficit
- Other type of stroke (hemorrhagic, lacunars)
- Comatosed patients
- Bilateral involvement
- Balanced disorder
- Medical instability
- Any recent fracture or surgery
- Recent myocardial infarction
- Auditory impairment
- perceptual defects
- reflex sympathetic dystrophy
- mental retardation
-
-
Study setting
Study was conducted at
-
-
-
- ASHWIN MULTI-SPECIALITY HOSPITAL.
- VIVEKANANDHA INSTITUTE OF MEDICAL SCIENCES , THIRUCHENCODE.
- OUT PATIENT DEPARTMENT PPG COMMUNITY CENTRE.
-
-
Study method
Subjects were divided into control group and Experimental group .
CONTROL GROUP :
15 subjects were treated with conventional physiotherapy.
EXPERIMENTAL GROUP :
15 subjects were treated with conventional physiotherapy and motor imaginary technique
Study duration
Study was conducted for a period of 6 months.
Parameters
limb only)
Motor performance for Fugl-Meyer assessment scale (Upper
Statistical Tools
To compare control Group and Experimental Group : Independent ‘t’ test:
Statistical analysis is done by using Independent ‘t’ test
n 1 n 2
n 2 n 2
X 1 X 2
t = S
S =
2 (x1 – x1 ) +
n 1 + n 2 – 2
2
( x 2 – x 2 )
x1 = mean value of control group
x2 = mean value of experimental group n1= number of observations in control group
n2= number of observations in experimental group S = standard deviation
Intra group analysis:
Statistical analysis is done by using Paired‘t’ test
n
s
t d
s =
d = difference between the pre-test Vs post test values d = mean difference
n= number of observations s = standard deviation
n n 1
d 2 ( d )
2
TREATMENT TECHNIQUE :
CONTROL GROUP :
IN SITTING:
Sitting on a firm flat surface, hands rests over bed, feet flat on floor, while therapist place one hand over elbow and other over wrist.
- Weight shifting to both sides.
- Clasping both hands forward, turning to sound side. While lifting the affected leg and crossing it over the sound side.
- Clasping both hands forward, turning to affected side. While lifting the sound leg and crossing it over the affected side.
- Sitting with crossed legs. The affected leg over the sound one. While both hand clasps and places over knee.
- Flexion and extension of knee. Therapist places one hand over foot other hand over knee.
FROM SITTING TO STANDING:
- Clasping both hands forward. Affected foot parallel with sound one. Therapist place one hand over sacrum and other hand over knee.
- Patient stands up weight bearing over affected leg.
Stage 1:Therapists assists in holding patient and help them to raise up. Stage 2: Assist by clasping hands forward and without therapist support. Stage 3: With one hand support.
Stage 4: Without hand support.
IN STANDING:
(i) Clasping both hands forward. Turning to both sides.
(i) Sitting and standing up.
FOR MOVEMENTS OF ARM:
- Elevation of arms with clasped hands.
- Moving clasped hands to face, while therapists hand prevents retraction of shoulder.
- Moving clasped hands above head, while therapists hand prevents retraction of shoulder.
- Mobilizing shoulder girdle with extended arm.
- Bilateral shoulder flexion exercises.
- Sitting push-ups to full elbow extension.
ICE THERAPY
placing the patients hand in a bucket of melting ice for a few seconds brings intense awareness of the part , reduces spasticty and often improves movement.
STRETCHING
all spastic muscles especially biceps brachii ,wrist and finger flexors.
LOWER LIMB EXERCISE
mobilising the leg and toes ,bridging exercise, activities on mat, weight bearing exercise, activites on tilt board.
TREATMENT DURATION AND REPETATION
60 minutes and 20 repetition per exercise HOME EXERCISE
needle and thread activity , button activity, peg board activities.
EXPERIMENTAL GROUP:
Conventional physiotherapy given as same as control and motor imaginary technique given.
Ask the patient to contract and relax his muscles(progressive relaxation).the patient was asked first to tighten the muscles of feet and then relax them, the same procedure followed in his legs , arms , and hand . this portion of audio tape is followed by 5-7 mins of suggestions for internal , cognitive visual images related to using affected arm in functional tasks (maintain interest ,3 scripts were
provided during 6 weeks interventions, one during first 2 weeks , second during second 2 weeks , third during third 2 weeks).
Internal, cognitive images were used in which patient received audio tape command imagine himself from third person perspective executing the tasks specified on mental practice audio tape .the intervention was intended to target and improved functional use the patients affected wrist and fingers as well as to secondary improve his ability to move out of synergy with affected arm.
During first 2 weeks , the audio taped functional task was reaching for grasping a cup , during the second 2 weeks , functional tasks practiced was turning pages in large book. during third 2 weeks task practiced was reaching for and grasping a item on a high self and bringing an item to himself, for each of this task the patient was urged to use all of his senses (eg. Feel your fingers grasp around the edge of the cup )
The duration of treatment is 20 minutes per session two session per
week.
Procedure
The subjects of both control group and experimental group were involved for pre test assessment by fugl- meyer assessment scale (hand component).
The subjects of control group were given conventional physiotherapy and experimental group were given conventional physiotherapy and motor imaginary technique
The treatment was given for 1 hour for a period of 4 weeks as 5 days per week, one session per day.
DATA PRESENTATION
TABLE I
Pre test and Post test values of control group using Fugl meyer scale
Control group | ||
S.NO | PRE-TEST | POST-TEST |
1 | 28 | 30 |
2 | 19 | 21 |
3 | 22 | 24 |
4 | 26 | 29 |
5 | 24 | 27 |
6 | 24 | 26 |
7 | 20 | 22 |
8 | 32 | 34 |
9 | 38 | 40 |
10 | 28 | 31 |
11 | 27 | 31 |
12 | 30 | 34 |
13 | 25 | 28 |
14 | 27 | 31 |
15 | 29 | 32 |
TABLE II
Pre test and Post test values of Experimental group using Fugl Meyer scale
Experimental group | ||
S.NO | PRE-TEST | POST-TEST |
1 | 19 | 24 |
2 | 26 | 31` |
3 | 25 | 30 |
4 | 32 | 36 |
5 | 28 | 37 |
6 | 28 | 35 |
7 | 27 | 34 |
8 | 25 | 32 |
9 | 24 | 29 |
10 | 27 | 34 |
11 | 37 | 39 |
12 | 20 | 29 |
13 | 24 | 31 |
14 | 22 | 30 |
15 | 28 | 34 |
DATA ANALYSIS AND PRESENTATION
TABLE-III
ANALYSIS OF PRETEST DATA OF CONTROL GROUP AND EXPERIMENTAL GROUP
TESTS | CONVENTIONALPHYSIOTHERAPY AND CONVENTIONAL PHYSIOTHERAPY WITH MOTOR IMAGINARY TECHNIQUE | |
Pre test mean value | Control Group | Experimental Group |
26.6 | 26.13 | |
Independent ‘t’ test | 0.24 | |
P value and its significance | P value > 0.05 is insignificant | |
For 28 degrees of freedom at 5% level of significance, the calculated pre test ‘t’ value between control group and Experimental group was 0.24 and the critical value was 1.701, which states that there is no significant difference between two groups.
GRAPH – I
PRE –TEST VALUES OF CONTROL GROUP AND EXPERIMENTAL GROUP
F

U 30
G
L- 25
M 20
E
Y 15
E
R 10
S
C 5
A
L 0
E


26.6
26.13

Pre Test
Post Test
Pre Test Pre Test
TABLE IV
ANALYSIS OF POST TEST DATA OF CONTROL GROUP AND EXPERIMENTAL GROUP
TESTS | CONVENTIONAL PHYSIOTHERAPY ANDCONVENTIONAL PHYSIOTHERAPY WITHMOTOR IMAGINARY TECHNIQUE | |
Post test mean value | control Group | Experimental Group |
29.33 | 34.8 | |
Independent ‘t’ test | 2.88 | |
P value and its significance | P value < 0.05 is significant | |
For 14 degrees of freedom at 5% level of significance, the calculated post test ‘t’ value between control group and Experimental group was 2.88and the critical value was 1.701 which states that there exists a significant difference between two groups.
GRAPH – II
POST –TEST VALUES OF CONTROL GROUP AND EXPERIMENTAL GROUP
F

U 40
G
30
–
20
E
Y
E 10
R
S 0
C A L E


34.8
29.33

Pre Test
Post Test
Post Test Post Test
TABLE V
ANALYSIS OF PRETEST AND POSTTEST DATA OF CONTROL GROUP
GROUPS | CONVENTIONAL THERAPY | |
Control group | Pre test mean value | Post test mean value |
26.6 | 29.3 | |
Paired ‘t’ test | 13.72 | |
P value and its significance | P value < 0.05 is significant | |
For 14 degrees of freedom at 5% level of significance, the student ‘t’ test value for control group (CONVENTIONAL PHYSIOTHERAPY) was 13.72 and the critical value was 1.761, which states that there exists significant difference between the pre test and post test values of control group
GRAPH – III
PRE TEST AND POST TEST VALUES OF CONTROL GROUP
F
U 40
G
L- 30
M
E 20
Y
E 10
R
S
C 0
A L E
29.33
26.6
Pre Test
Post Test
Pre Test Post Test
TABLE VI
ANALYSIS OF PRE TEST AND POST TEST DATA OF EXPERIMENTAL GROUP
GROUPS | CONVENTIONAL PHYSIOTHERAPY AND MOTOR IMAGINARY TECHNIQUE | |
Experimental Group | Pre test mean value | Post test mean value |
26.13 | 34.8 | |
Paired ‘t’ test | 17.95 | |
P value and its significance | P value < 0.05 is significant | |
For 14 degrees of freedom at 5% level of significance, the student ‘t’ test value for Experimental group II (conventional physiotherapy and motor imaginary technique) was 17.95 and critical value was 1.761, which states that there exists significant difference between the pre test and post test values of Experimental group
GRAPH – IV
PRE TEST AND POST TEST VALUES OF EXPERIMENTAL GROUP
F U
G 30 L
–
M 20 E
Y
E 10 R
S
C 0
A L E
34.8


26.1

Pre Test Post Test

Pre Test
Post Test
RESULTS
Effectiveness of control Group (conventional physiotherapy) is elicited by comparing the pre test and post test values of experimental group using paired ‘t’ test; the calculated value is 13.72 , whereas the critical value is 1.761. Since the calculated value is greater than the critical value, there exists a significant difference between the pretest and post test values of control group .
Effectiveness of Experimental group (conventional physiotherapy with motor imaginary technique) is elicited by comparing the pretest and post test values of Experimental group using paired ‘t’ test, the calculated value is 17.95, whereas the critical value is 1.761. Since the calculated value is greater than the critical value, there exists a significant difference between the pretest and post test values of Experimental group
While comparing the post test values of control group and Experimental group using independent ‘t’ test, the calculated value is , 2.88 whereas the critical value is 1.761, which shows that there exists a significant difference between the post test values of two groups.
When comparing the mean values of both, the post test mean value of control group 29.33 is lesser than the post test mean value of Experimental group 34.8 which confirms that Experimental group shows a significant improvement than control group.
Rehabilitation of stroke patients is a complex and difficult procedure. Various physiotherapy strategies evolved over the years for the rehabilitation of stroke patients.
Motor imaginary technique is the therapeutic programme which aims at the optimization of function by training patients in various tasks related to the daily activities.
This study is to find out the efficiency of Motor imaginary technique in improving upper limb function as evidenced by the outcome measure Fugl Meyer
assessment scale (upper limb component). Motor imaginary technique in hemparetic patients with middle cerebral artery involvement.
Result obtained from statistical analysis between pretest and post test values of experimental group and control group at 5% level of significance showed significant improvement in Fugl Meyer Assessment Scale by Motor imaginary technique following 4weeks of exercise programme.
Analysis of results shows that there in an increase of 24% in outcome measure of Fugl Meyer Assessment scale.
DISCUSSION
Rehabilitation of the hemiplegic patients is essential for improving functional activities.stroke affects patient’s normal activities of daily living and make them dependent to others .
The purpose of this study is to synthesize the relavant literature about motor imaginary technique in order to facilitate its integration in to physical therapist practice .
SUSAN B.O’ SULLIVAN described occlusion of the proximal middle cerebral artery produces extensive neurological damage with significant cerebral oedema .increased intracranial pressure typically lead to loss of consciousness ,brain herniation and possibly death.
The most common characteristics of middle cerebral artery syndrome or contralateral spastic hemiparesis and sensory loss of face , upper extremity and lower extremity, with the face and upper extremity more involved than the lower extremity .
MAGILL suggested that mental practice is effective because it augments existing motor schema .at the level pretest the patient had limited ability to use the affected wrist and fingers but a greater ability to perform gross movements with the affected arm , as indicated by his scores on items on fugl-meyer scale.
After participating in mental practice intervention targeting grasping , reaching and gripping behaviours the patient maintained his gross motor score while improving on the fine motor components of fugl-meyer scale , at the post test the specificity of the changes in the areas targeting suggests enhancement of the existing motor plan as a possible mechanism.
Frequent practice of skill causes improved motor performance , motor imaginary technique , when combined with physical practice has been shown to be even more effective in improving motor performance than physical practice alone . one viable hypothesis is that during mental practice concurrent activity occurs in
musculature and in the appropriate neuro motor pathways. this correlative neuro motor activity is similar to the activity that we hypothesize occurs with repetitive physical practice and is responsible for motor performance improvements that individuals exhibit after mental practice .
We believed that the patient improvements between the pretest and the post test occurred because the patient, through mental practice, was provided with additional practice of functional tasks using the affected arm.
On a physiological level we believed that this practice caused priming of the motor cortex and appropriate activation of the neuro motor pathways, which resulted in the patient’s improvements. we believed that correlating changes in motor behaviour with changes in cortical organization using functional magnetic resonance imaging might substantiate this claim.
Mental image of movement can be generated independent of behavioural output of paretic limb.as patients motor function began to improve daily activities using the affected limb were implemented . outcome measures were grip strength shoulder flexibility and time to complete common daily activities such as dressing and inserting a key in lock with greater precision and ease of movement .
The functional activities of stroke patients is measured by fugl-meyer scale. it is an impairment based scale test items organized by sequential recovery stage (BRUNNSTORM 2007)
Thus, motor imaginary technique may provide a valuable tool to access the motor network and improve outcome after stroke .
Hence , it thought this form of technique can prove useful in stroke patients who have lost movements.
Therefore when combing motor imaginary technique with conventional physiotherapy it improves upper limb function which is revealved in this present research work.
SUMMARY AND CONCLUSION
This is study finds out the efficacy of Motor imaginary technique in improving upper limb function in middle cerebral artery stroke.
In 30 patients the upper limb function was measured by Fugl Meyer assessment.
The control group subjects were given conventional physiotherapy and experimental group were given conventional physiotherapy and motor imaginary technique. For both groups various exercise through peg board, pronation- supination board, threading board.
The subjects were strictly instructed not to sleep during the treatment Initially patient feel difficult in imnagine and also feels bore . Samples were given conventional physiotherapy for lower extremity.
The duration of the treatment program was 4 weeks treatment motor performance was done through Fugl Meyer assessment scale.
My study concluded that the calculated value was above the significant value, strictly proves that the motor imaginary technique was very effective in improving upper limb function in middle cerebral artery stroke.
LIMITATIONS AND SUGGESTION
-
-
-
- This study was very short term and therefore to make it more valid long term is necessary.
- Since the study has been done with smaller number of subjects further studies should be conducted with large group of population.
- Motor imaginary technique is not well applicable for stroke patients who are having cognitive and sensory defect
- Though the Fugl Meyer Assessment and were administered objectively bias is possible, further study can be done other reliable assessment tools.
- Variation in calamite, drugs, diet, personal habit, side of involvement, gender, age could not be controlled.
-
-
References
- A.B.Taby, Neurorehabilitation, Principles and practice, 2/e, 2001, Ahuja Publications.
- Berta Bobath, Adult hemiplegia, Evaluation and treatment, 3/e, 1990, Butterworth- Heinemann page89-182.
- Carole.B.Lewis, Geriatric Physical Therapy and clinical approach, page 379-396.
- Catherine.A.Trombly, Neurophysical and development of treatment approaches, page 91-103.
- Darcy Ann Umphred, Neurological Rehabilitation, 2/e, 1990, Mosby, page 772-776.
- Glady Samuel Raj, Physical Therapy in Neuro conditions, 1/e, 2006, Jaypee Brothers, page 28-30.
- Janet H. Carr, Neurological Rehabilitation, 1998, Elsevier, page 220-260.
- Janet H. Carr, Stroke Rehabilitation optimizing motor performance, 1/e , 2003, Butterworth- Heinemann. Page129-205.
- Janet M. Howle Neuro-developmental treatment approach: theoretical foundations , Page 319
- Joel A Delisa – Editor, Physical Medicine and Rehabilitation Principles and Practice,4 /e, 1998, Lippincott , page 986-990.
- John Gilroy, Basic neurology, 3 /e, 2000, McGraw- Hill, page 225-227.
- John Walton- Editor, Briain’s disease of Nervous system, Oxford.
- Kenneth W. Lindsay, Neurology and Neuro surgery illustrated, 4/e, 2004, Elsevier. page 239-269.
- Mary Kessler, Neurologic intervention for physiotherapists, 2000, Saunders publications, page 89-129.
- Patrica.A.Downie, Cash’s Text book of Neurology for physiotherapists, 4
/e, 2007, Jaypee, page 194,213-254.
- Raine S. The current theoretical assumptions of the Bobath Concept as determined by the members of BBTA. Physio Therapeutical Practice. 2007; 23: page137–152.
- Raymond D.Adams, Principles of Neurology, 6 /e, 1997, McGraw hill.
- Sethi P.K. Stroke: incidence in India and management of ischaemic stroke. Neurosciences Today, 2002 6 (3). page. 139-143
- Stuart.B.Porter, Tidy’s physiotherapy, 13/e, 2003, Butterworth and Heinemann, page446.
- Susan B.O’ Sullivan, Physical Rehabilitation, 5/e, 2006, JaypeeBrothers, page 388-755.
- Susan Edwards- Editor, Neuro physiotherapy, 2 /e, 2002, Livingstone.
- INTERNATIONAL JOURNAL OF PHYSICAL THERAPY: ISSN 2079-9209
- JOURNAL OF NEUROLOGICAL PHYSICAL THERAPY
WOLTER KLUVER
- THE JOURNAL OF NEUROLOGIC PHYSICAL THERAPY
EDELLE C. PT.Phd
- INDIAN JOURNAL OF PHYSIOTHERAPY AND OCCUPATIONALTHERAPY
ISSN 0973 5674
- INTERNATION JOURNAL OF THERAPY AND REHABILITATION
LEVIN.S CARDOSA
- JOURNAL OF PHYSICAL THERAPY EDUCATION
HUNGIKO
- JOURNAL OF PHYSICAL THERAPY SCIENCE
ALEXANDRA VA23313
- JOURNAL OF PHYSIOTHERAPY RESEARCH AND PRACTICE
KLUHNKI
- JOURNAL OF NEROREHA
NADINE.DECK
- JOURNAL OF SMOKING AND RISK OF STROKE
HANKEY GJ
- AMERICAN JOURNAL OF CLINICAL NUTRITION
LARSSON S.C
- JOURNAL OF CEREBRAL CIRCULATION
GORELICK PB
- JOURNAL OF INTERNATIONAL SOCIETY OF PATHOPHYSIOLOGY OF STROKE
DEB P SHARMA
- THE NEW ENGLAND JOURNAL OF MEDICINE
LEES K.R
- JOURNAL OF THROMBOSIS AND HAEMOSTASIS
GUERCINI .F
APPENDIX – I
CASE ASSESSMENT PROFORMA
CASE NO | : |
NAME | : |
SEX | : |
ADDRESS | : |
DATE OF ADMISSION | : |
DATE OF EVALUATION | : |
HISTORY | : |
ON OBSERVATION | : |
ON EXAMINATION | : |
TREATMENT | : Motor imaginary technique |
MEASUREMENT TOOL | : fugl-meyer scale |
S.NO. | PRE TEST | POST TEST |
APPENDIX – II
PATIENT CONSENT FORM
TITLE: “A COMPARATIVE STUDY ON EFFECTIVENESS OF MOTOR IMAGINARY TECHNIQUE ON IMPROVING UPPER LIMB FUNCTION IN MIDDLE CEREBRAL ARTERY STROKE .”
INVESTIGATOR: _ _ _ _ _ _ _ _ _ _ _
PURPOSE OF THE STUDY:
I ,have been informed that this study will work
towards achieving on the functional activities of daily living in post-stroke conditions for me and other patients.
PROCEDURE:
Each term of the study protocol has been explained to me in detail. I understand that during the procedure, I will be receiving the treatment for one time a day. I understand that I will have to take this treatment for four weeks.
I understand that this will be done under investigator, _ _ _ _ _ _ _ _ _ _ _ _ _
_ _ supervision. I am aware also that I have to follow therapist’s instructions as has been told to me.
CONFIDENTIALITY:
I understand that medical information provided by this study will be confidential. If the data are used for publication in the medical literature or for teaching purposes, no names will be used and other literature such as audio or video tapes will be used only with permission.
SRISK AND DISCOMFORT:
I understand that there are no potential risks associated with this procedure, and understand that investigator will accompany me during this procedure. There are no known hazards associated with this procedure.
REFUSAL OR WITHDRAWL OF PARICIPATION:
I understand that the decision my participation is wholly voluntary and I may refuse participate, may withdraw consent at any time during the study.
I also understand that the investigator may terminate my participation in the study at anytime after researcher has explained me the reasons to do so.
I _ _ _ _ _ _ _ _ _ _ _ _ _ _ have explained to
…………………………………. the purpose of the research, the procedures required and the possible risks and benefits,to the best of my ability.
…………………………………… …………………………… investigator Date
I Confirm that researcher has explained me
the purpose of the research, the study procedure and the possible risks and benefits that I may experience. I have read and I have understood this consent to participate as a subject in this research project.
…………………….. ………………………… Subject Date
……………………….. …………………………. Signature of the Witness Date
APPENDIX – III
FUGL MEYER ASSESSMENT SCALE
Area | Test | Scoring | Maximum Possible Score | Attained Score |
Motor I Reflex
| 0 – No reflex activity can sbe elicited 2 – Reflex activity can be elicited | 4 | ||
II. Flexor Synergy Elevation—– Shoulder retraction- Abduction (at least 90) — External rotation —- Elbow extension —- |
| 12 |
Forearm supination— | ||||
III. Extensor Synergy Shoulder adduction/internal rotation—- Elbow extension —- Forearm pronation – |
| 6 | ||
|
0- Correct position of should and elbow | 6 |
cannot be attained, and/ or pronation or supination can not be performed at all
correct positions at elbow and shoulder. | ||||
|
| 6 |
c. Pronation/supination of forearm elbow at 0 and shoulder between 30 – 90 of flexion—- | during shoulder flexion 2- Faultless motion
| |||
VI. Normal reflex activity Biceps and/or finger flexors and triceps—— | (This stage, which can render the score of two, is included only if the patient has a score of 6 in stage V).
| 2 |
are hyperactive. | ||||
VII.
| a) 0- Patient cannot dorsiflex wrist to required 15 1- Dorsiflex is accomplished, but no resistance is taken 0- Position can be maintained with some (slight) resistance. b) 0- Volitional movement does not occur
| 10 |
e. Cirumduction |
| |||
VIII.
| a) 0- No flexion occurs.
b) 0- No extension occurs
c) 0- Required position cannot be acquired 1- Grasp is well 2. Grasp can be maintained against relatively great resistance d) 0- Function cannot be performed | 14 |
|
| |||
IX. Coordination/ speed – finger to nose (five repetitions in rapid succession) | a) 0- Marked tremor 1- Slight tremor 2- No tremor | 6 |
|
2- Do dysmetria
1- 2 to 5 seconds longer than unaffected hand 2 Less than 2 seconds difference. | |||
TOTAL MAXIMUM SCORE OF UPPER EXTREMITY | 66 | |||
AcUTE TRAUMATIC injury in competitive CYCLING IN INDIA
(ROAD AND TRACK CYCLING)
Himanshu1 and Sinha A.G.K.2
- MPT (Sports), Department of Physiotherapy, Punjabi University, Patiala
- Professor, Department of Physiotherapy, Punjabi University, Patiala
Abstract
Background – The lifestyle is changing now a days as the Cycling becomes mode of transport and type of physical activity too for many people. But it is also one of the international sport in modern history and In India, cycling is one of the game which is growing now a days among the people. The events in cycling are road and track cycling in which injuries are sustained. Acute injury can also act as a barrier in participating of cycling. These events also consists of many events like team pursuit, sprint and many more individual events.
Objective – The aim of the study was to find out the prevalence of acute injuries in competitive cycling.
Methods – The sample was consisting of 102 subjects and schedule interview was used to collect the data. The schedule was developed according to type of injury. The injury was documented in forms which were formulated on the basis of type of injury and incidence time.
Results – The results shows that out of total 102 subjects, 35 (34.5%) subjects were found injured at the time of survey. Among the total 35 injured cyclists 20 cyclists were found with 1st time occurrence of injury whereas the 15 cyclists were injured in previous year. The acute injury was less prevalent in comparison to the overuse injuries. Knee injury (50%) was more prevalent in acute injuries in comparison to another anatomical sites.
Conclusion– It was found that cycling is a game with the less prevalence of acute injuries, with a greater number of injuries in lower extremity followed by upper-extremity and trunk with the association of risk factors. Future studies should focus on prospective study on injuries in cycling and parameters of bicycle as risk factor of injury.
Introduction –
The static bicycle at home and fitness centers is used for improving health and lifestyle of inactive as well as fit people (Gordon and Schultz, 2010). The cycling is efficient mode of transportation but it is also a sport. Cycling is considered as an unsafe game because of its long and monotonous training programmes. Bicycle crashes and falls are rare but they can cause number of injuries ranging from minor to permanent disability and even loss of carrier of a cyclist (Olivier and Creighton, 2018). In recent years, the attention is increasing to encounter of accurately measuring the extent and severity of injury (Clarsen et al., 2014). Worldwide there are many studies conducted in cycling sports (Dannenberg et al., 1996; Weiss, 1985; Wilber et al., 1995; Clarsen and Krosshaug, 2010) but there are limited number of studies in India. There are no studies on overall occurrence of injuries in cycling in India. Lack of epidemiological studies on the occurrence of injuries is acting as a barrier in developing the preventive programmes which are further resulting into decline in performance of the cyclists. This study will focus on epidemiology of injuries in competitive cyclists which will help to identify the occurrence of injury in context of anatomical site of body, gender variation, severity and time loss due to injury.
Material and methods-
- Recruitment method and Data collection procedure –
102 cyclists were involved in this study (80 males and 22 female cyclists) and were recruited using the cross sectional survey method. The data was gathered on the basis of schedule interview using the convenient sampling method with capturing of competitive cyclists as much as possible.
- Preparation of schedule interview and data collection –
After the extensive review of literature, an interview schedule was developed. The initial draft was consisting of 40 questions including the demographic details and the injury data according to anatomical sites. Pilot study was performed on 10 subjects. As per suggestion of supervisor and cycling coaches, a new schedule interview was formulated on the basis of kind of injury, impact, severity and time loss. 4 forms were formed according to the type of injury and time of occurrence (Present and past history of injury).
- Study Protocol –
The investigator personally went to the various sports academies and met various coaches. Coaches were taken into assurance by explaining them in detail about the aims, objectives, purpose and significance of the study that the study will totally focus on the injury occurrence and will not inhibit any of cyclist’s practice and competition. The data was collected from various cycling academies of various regions in Punjab and Haryana. The cyclists were interviewed during the competition, practice schedule in appropriate breaks times to not to disturb competitors and practice session. Investigator assured them that the data will be confidential only for this research.
- Inclusion criteria –
Cyclists with age group of 18-25 years having more than one year of experience of cycling were involved.
Data Analysis and statistical methods –
Mean, standard deviation and percentage were used to prepare summary statistics. Independent frequency tables were used to determine the results by SPSS respectively.
Results and Discussion
Response rate – Total 102 cyclists were involved in the study, completed the questionnaires because of which the response rate was 100%.
Subject characteristics – The mean and standard deviation of cyclist’s age, height, weight, experience and total training hours which were 20.26+2.277, 68.09+2.982, 65.74+9.554, 2.88+1.253,1307.31+145.979 respectively.
Table 1 – Distribution of cyclists according to the demographic data –
Variables | Mean | Standard Deviation |
Age (in years) | 20.26 | 2.27 |
Height (in inches) | 68.09 | 2.98 |
Weight (in kilograms) | 65.74 | 9.55 |
Experience (in years) | 2.88 | 1.25 |
Training hours (in hours) | 1307.31 | 145.97 |
Prevalence of injuries –
Prevalence of injuries among the competitive cyclists was 34.3% (n=35 out of 102). Among the subjects, 59.9% (13 out of 22) females were found symptomatic whereas the corresponding figure for male was 27.5% (22 out of 80).
Table 2 – Distribution of competitive cyclist according to injury sustained –
Injured cyclists | Non injured cyclists | Total number of competitive cyclists |
35 (34.3%) | 67 (65.7%) | 102 (100%) |
Figure 1B
Figure 1A
Figure 1C
Figure 1A, 1B, 1C shows distribution of cyclists according to injury group and gender based analysis of injury.
Higher proportion of injuries (36%) was in cyclists who were participating in both the events (road and track) followed by road cyclists (34.5%) and track cyclists (individual event). It is evident that as the level of participation increased, the occurrence of injury reduced. Incidence of injury was relatively more at the level of School and District (50% each) followed by University (42.9%), State (36%) and National level cyclists (30.3%).
Figure 02
Majority (60%) of the injured cyclists were affected with the overuse injuries followed by acute injuries (40%). Acute injury was more prevalent in the cyclists who were participating in both road and track cycling (62.8%, 85.3%) in comparison to the those who were participating in individual events only. 31 cyclists reported with only one injury whereas 04 cyclists were found with two injuries. Total 18 acute injuries were observed in 14 (out of 35) acutely injured cyclists. Knee (50%) was the most frequently injured body part. 55.6% of acute injuries were severe and also causing time loss from the training. Fall on the surface was the most common mechanism of acute injury.
Figure 03
Severity
66.6 % injuries resulting from fall were severe, causing time loss from the training. 38.9% injuries were moderate following which cyclist could continue training but with reduced intensity or volume. 3 (16.66%) injuries were moderate injury resulting from due to collision with other cyclist. According to the Impact of acute injury, 60 % of severe acute injuries affected the knee (6 out of 10) in which cyclists were not able to participate in the game.
Among the total 10 injured cyclists, 01 was found with severe acute injury (28 days time loss). 71.4% cyclists affected with current acute injury had taken medical consultation. 28.6% cyclists continued their game without any consultation.
Discussion
Study of Lindquist et al. (1986) and Lee & Chou (2008) reported that maximum of the acute traumatic bicycle injuries were due to the fall and rest of were due to the collision.
Knee (50%) was the most frequently injured body part and the acute injuries were found more in lower extremities. Earlier reports have observed injuries to the other body parts as more frequent. Lindquist et al. (1986) observed higher prevalence of head injuries with less involvement of lower limb injuries. On the other hand, Chow et al. (1993) reported far more involvement of lower extremity [51%] than what was observed in this study (9.1%) which may be attributed to their larger sample size. The sample size of Chow et al. (1993) was 459 whereas the sample size of present study was 102. However Kloss et al. (2006) reported equal prevalence of lower and upper limb injuries. The limitation of the present study was a relatively small sample size, with source of sample restricted to a given geographical area and reliance on patient reported information. Design of the study did not allow the independent assessment of injury. Further the cross sectional survey method has its own limitations. It is imperative to cross validate the findings of this study on a larger sample size involving competitive cyclists across India. A prospective study of one to two year duration would through more light on the pattern of injuries in Indian competitive cyclists.
Conclusion
It was found that cycling is a game with the less prevalence of acute injuries, with a greater number of injuries in lower extremity followed by upper-extremity and trunk with the association of risk factors. The overuse injuries are more prevalent in cycling as the cyclists who were participating in both events were found injured and knee was the most common anatomical location of the injury. Future studies should focus on prospective study on injuries in cycling and parameters of bicycle as risk factor of injury.
References –
- Armsey, T.D. and Hosey, R.G. (2004). Medical aspects of sports: epidemiology of injuries, preparticipation physical examination, and drugs in sports. Clinics in sports medicine, 23(2), pp.255-279.
B D Wiess. (1985). Non traumatic injuries in amateur long distance bicyclists; The American Journal of Sports Medicine; pp-187-189.
Bahr, R. and Krosshaug, T. (2005). Understanding injury mechanisms: a key component of preventing injuries in sport. British journal of sports medicine, 39(6), pp.324-329. Bhardwaj S; Common sports injuries and their management; International Journal of Informative and Futuristic Research 2013 pp-44-65.
Bhar R. Engebreston L. (2009). Handbook of sports medicine, sports injury prevention pp-2-3.
Burkner P, Khan K. (2007). Principle of injury prevention; clinical sports medicine, pp-113-116.
Chow TK, Linda L, Brecker MD, Patrick K. (1993). Acute injuries in Mountain Biking; pp-145-149.
Clarsen B, BahrR, Heyman MW, Engedhal M, Midtsunstad, Rosenlund L, Thorsen G, Mykeibust G. (2014). The prevalence and impact of overuse injuries in five Norwegian Sports: Application of a new surveillance method; Scandinavian Journal of Medicine and Science in Sports.
- ClarsenB, Krosshaug T. (2010). Overuse injuries in professional cyclists; The American Journal of Sports Medicine.
- Comfort P, Abrahmson E. (2010). Sports rehabilitation and injury prevention; 1 (pp-3).
- Gulam Aafid. (2016). Need, importance and benefits of exercise in life, International journal of Physical education, sports and health (pp-127-130).
- Hägglund, M., Waldén, M., Bahr, R. and Ekstrand, J. (2005). Methods for epidemiological study of injuries to professional football players: developing the UEFA model. British journal of sports medicine, 39(6), pp.340-346.
- Holmes JC, Pruitt AL, Whalne NJ. (1993), Iilliotibial band syndrome in cyclists; pp-419-424
- Kloss FR, Tuli T, Gassner R. (2006). Trauma injuries sustained by a cyclists; pp-77-84.
- Kronisch RL, Rubi AL. (1994). Traumatic injuries in off road cyclists; pp-240-244.
- Lee KH, Chou HJ. (2008). Facial fractures in road cyclists; Australian Dental Journal; pp-246-249.
Lindquist C, Sorsa S, Hyrkas T, Santavitra S. (1986). Maxillofacial fractures sustained in bicycle accidents; International Journal of Oral Maxillofacial surgeries; pp-12-18.
“TO COMPARE THE EFFECTIVENESS OF MUSCLE ENERGY TECNIQUE AND SOFT TISSUE MASSAGE TECHNIQUE FOR IMPROVMENT OF PAIN AND FUNCTIONAL DISABILITY ON MECHANICAL LOW BACK PAIN PATIENTS”
Dr. Pragya Bhatt, M.Sc. Anatomy (Medical), Dr. Arushi Tandon, B.P.T.,
ABSTRACT
BACKGROUND: Low back pain is ranked first as the cause of disability and the inability to work. It is found to occur at least once in a lifetime in about 90% of the world’s population. Low back pain is leading cause of disability in people under 45 years of age and account for 50% of all disability claims in west. Every year 3-4% of the population is temporarily disabled and 1% of the working age population is disabled totally and permanently because of LBP. Age, gender, occupation, recurrent weight lifting, weakness of abdominal muscles, obesity, smoking, increased lumber lordosis and scoliosis are some of the known risk factors of LBP. NEED OF THE STUDY: No study has been done to find the effectiveness the muscle energy technique and soft tissue massage technique for improvement of pain and functional disability mechanical low back pain patients. There for the need of the study arises to compare the effectiveness the muscle energy technique and soft tissue massage technique for improvement of pain and functional disability mechanical low back pain patients. The need of the study was to evaluate the effect of the muscle energy techniques and soft tissue massage techniques for improvement of pain and functional disability on mechanical low back pain patients. AIMS AND OBJECTIVES: To compare the effectiveness between Muscle energy technique and soft tissue massage technique for improvement of pain and functional disability on mechanical low back pain patients. METHODOLOGY: 30 patients with diagnosed chronic mechanical low back pain was randomly be selected according to inclusion and exclusion criteria and divided into two groups Group A: muscle energy technique Group B: soft tissue massage technique. Both the groups were assessed for the pain status using visual analog scale and functional disability using oswestry low back pain disability questionnaire. These parameters were assessed before the start of the program as pre test values and at the and of 20 week as post test values. Group A received Muscle Energy Technique and Group B Soft tissue massage Technique. RESULT: The mean age of group A was 27.13 years and group B was 26.87 years. The statistical analysis correlates the study by proposing that groups taken for study either group A treated by Muscle Energy Technique and Group B Soft tissue massage Technique showed significant effect in improvement in pain and functional disability. The group A treated with Muscle Energy Technique had higher significant when compared to group B treated with Soft tissue massage Technique. The mean improvement in pain scores of VAS was 4.94 in group A and 3.6 in group B. the mean improvement in functional disability measured by oswestry LBP questionnaire was 26.73 in group A and 18.6 in group B. it was resulted that group A received Muscle Energy Technique had a superior effect over Group B received Soft tissue massage Technique. CONCLUSION: This study concluded that muscle energy technique was more effective in improvement of pain& functional disability for mechanical low back pain. KEY WORDS: VAS, MET, STM.
INTRODUCTION
Low back pain is usually nonspecific or mechanical. Mechanical low back pain arises intrinsically from the spine, intervertebral disks, or surrounding soft tissues. Red flags include progressive motor or sensory loss, new urinary retention or overflow incontinence, history of cancer, recent invasive spinal procedure, and significant trauma relative to age. Imaging on initial presentation should be reserved for when there is suspicion for cauda equina syndrome, malignancy, fracture, or infection. Plain radiography of the lumbar spine is appropriate to assess for fracture and bony abnormality, whereas magnetic resonance imaging is better for identifying the source of neurologic or soft tissue abnormalities.(1) Low back pain is ranked first as the cause of disability and the inability to work. It is found to occur at least once in a lifetime in about 90% of the world’s population. Low back pain is leading cause of disability in people under 45 years of age and account for 50% of all disability claims in west. Every year 3-4% of the population is temporarily disabled and 1% of the working age population is disabled totally and permanently because of low back pain (LBP). Age, gender, occupation, recurrent weight lifting, weakness of abdominal muscles, obesity, smoking, increased lumber lordosis and scoliosis are some of the known risk factors of LBP.( 1 )
There are multiple treatment modalities for mechanical low back pain, but strong evidence of benefit is often lacking. Moderate evidence supports the use of nonsteroidal anti- inflammatory drugs, opioids, in the short-term treatment of mechanical low back pain. There is little or no evidence of benefit for acetaminophen, antidepressants (except duloxetine), skeletal muscle relaxants, lidocaine patches, and transcutaneous electrical nerve stimulation in the treatment of chronic low back pain. There is strong evidence for short-term effectiveness and moderate-quality evidence for long-term effectiveness of yoga in the treatment of low back pain.(2)
Various spinal manipulative techniques (osteopathic manipulative treatment, spinal manipulative therapy) have shown mixed benefits in the acute and chronic setting. Physical therapy modalities such as the McKenzie method may decrease the recurrence of low back pain and use of health care. Educating patients on prognosis and incorporating psychosocial components of care such as identifying comorbid psychological problems and barriers to treatment are essential components of long-term management.(2)
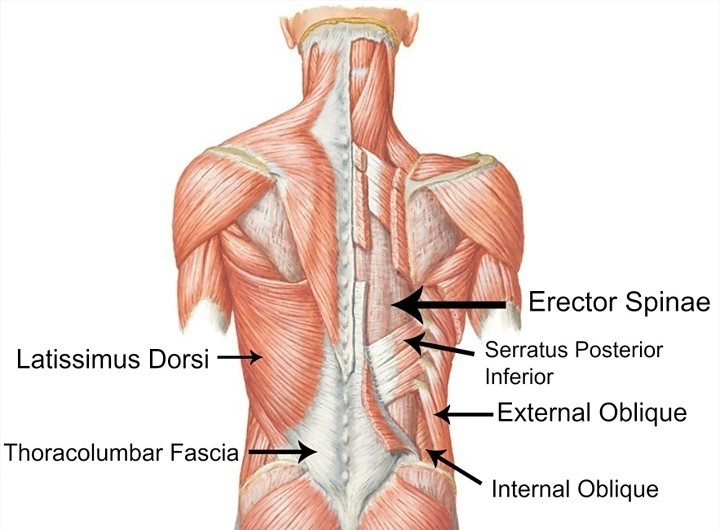
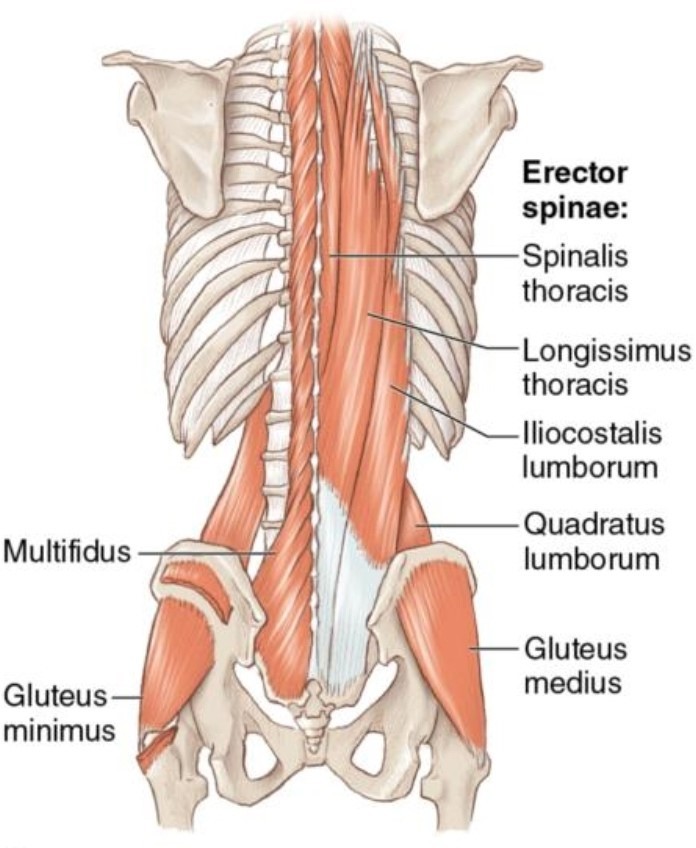 Anatomy of core muscles of Back
Anatomy of core muscles of Back
Mechanical low back pain refers to back pain that arises intrinsically from the spine, intervertebral disks, or surrounding soft tissues. This includes lumbosacral muscle strain, disk herniation, lumbar spondylosis, spondylolisthesis, spondylolysis, vertebral compression fractures, and acute or chronic traumatic injury. Repetitive trauma and overuse are common causes of chronic mechanical low back pain, which is often secondary to workplace injury. Most patients who experience activity-limiting low back pain go on to have recurrent episodes. Chronic low back pain affects up to 23% of the population worldwide, with an estimated 24% to 80% of patients having a recurrence at one year.(2)
LBP is the most common health problem that affects work performance and quality of life. It’s defined as pain, stiffness and discomfort experienced in the area lying on the posterior aspect of the body from the lower margin of the twelfth rib to the lower gluteal folds that could be referred into one or both lower limbs lasting for at least 1 day. LBP may be classified by duration as acute (pain less than 6 weeks), sub-acute (6 to 12 weeks), or chronic (more than 12 weeks) or by the underlying cause (non-mechanical or mechanical).
Mechanical low back pain (MLBP) or Unspecified is defined as low back pain not attributable to recognizable, known specific pathology. It is the leading cause of disability amongst the major musculoskeletal conditions which leads to Impairments, Activity limitations and Participation restrictions. Therefore it becomes a psychosocial/economic burden on individuals, families, communities, industries and government. Existing literature shows globally 40% to 50% of people have LBP at some point in their lives and there exists a challenge in Africa on the best rehabilitation methods for low back pain which could prevent chronic pain and disability as evident in a literature. (2)
Musculoskeletal disorders are a comorbid condition strongly linked to LBP. A moderate association was found when considering the whole musculoskeletal chapter, a stronger association was found when considering the somatoform symptoms related to the musculoskeletal cluster. In patients with low back pain (LBP), alterations in fiber typing in Multifidus and erector spinae are assumed to be possible factors in the etiology and/or recurrence of pain symptoms as it negatively affects muscle strength and endurance. Most patients that suffer from MLBP experience pain in the lower area of the back (lumbar and sacroiliac regions) and mobility impairment. Pain can also radiate in the lower extremities, or generalized pain can be present. Patients with MLBP can also experience movement and coordination impairments. This could affect the control of voluntary movements of the patient.(2)
Muscles Energy Technique(MET): The participant will be asked to lie supine on a couch with the hip at the edge and both lower limbs freely off the couch. The participant would place one of his legs over the therapist’s shoulder and push up with the opposite leg into therapist’s hand. A total of 4 contractions will be resisted by force equal to the participant’s, held for 5sec with 5sec rest b/w each contraction. Also, restriction barrier (i.e. where movement is not possible due to impairment resulting from LBP) will be identified and the patient will be instructed to make a contraction of about 20-30% 0f maximal voluntary isometric contraction, held for 8-10secs, relaxed for 2-3secs and the limb will be moved to a new barrier. The procedure is repeated for about 4-6 times.[19] Lewit et al., (1984) in their study found that MET when applied, while the back muscles, there was a greater relief in pain, spasm, and tenderness in the affected muscle.(19)
Muscles Energy Technique as a physiotherapy procedure was found to be effective to be effective in the management of acute and subacute Mechanical Low Back Pain, however, its effectiveness in MLBP is yet to established in terms of preventing recurrence, reducing pain, improving trunk stability, Quality of Life, Functional Disabilities, activity limitation and Participation restriction associated with MLBP. The technique is classified as an active technique in which the patient voluntarily uses his muscles from a precisely controlled position in a specific direction, against a distinctly executed counterforce by the therapist.
MET may be used to lengthen a shortened or spastic muscle, to strengthen weakened muscles, to reduce localized oedema, or to mobilize restricted joint motion of the body. The function of any joint in the body which can be moved by voluntary muscle action, directly or indirectly, can be influenced by MET. Although, the physiological mechanisms underlying the therapeutic effects of MET are unclear, but may involve a variety of neurological and biomechanical mechanisms, including hypoalgesia altered proprioception, motor programming and control, and changes in tissue fluid. Therefore the purpose of this study is to determine the effectiveness of MET, its influence on the reducing level of pain perception, Stability of Spine, quality of life, functional disability, activity limitation and participation restriction of patients with the chronic MLBP.(19)
Soft Tissue Massage Technique– Massage is the manipulation of the soft tissue in body. The soft tissue massage is a generic term for any modality that used to treat the soft tissues in the body including muscle, fascia, and scar tissue. The soft tissue massage applied in the longitudinal direction along the length of the muscle with the therapist finger tips and massage cream.The effects of massage therapy are presumably produced by more than one
mechanism. It has been proposed to increase the extensibility of soft tissue including muscle, Tendon , fascia, the joint capsule and ligaments, by preventing the formation of fibrosis and adhesions. Massage therapy involves the use of biomechanical pressure exerted on deformable muscle tissue for the purpose of improving muscle extensibility and joint ROM. It is said to improve muscle-tendon unit compliance by reducing its active and passive stiffness Increased muscle-tendon unit compliance is achieved by mobilising soft tissue and elongating shortened or adhered fibrous connective tissue.
Massage therapy aims to stimulate the proprioceptive receptors of the skin and underlying tissues through touch and pressure and is believed to improve mechanical function of the musculoskeletal system. It has been proposed to increase the extensibility of soft tissue including muscle, tendon, fascia, the joint capsule and ligaments, by preventing the formation of fibrosis and adhesions. (7)
The soft tissue massage was applied in the longitudinal direction along the length of the muscle with the therapist’s fingertips and massage cream. The therapists were told that the massage should be at an intensity that may produce some discomfort but that this discomfort should not extend past the cessation of the massage. The therapists were allowed to, concentrate more on one area of concern for the participant if this location was the focus of the symptoms. Finger Kneading and thumb kneading Massage: restoring mobility to supraspinous ligaments, quadretus lumborum, erector spine and glutei. (9)
Massage was directed at each of the following areas:
- Osseous and ligamentous structure: These structures are responsible for the passive stiffness that is imparted onto the lumbar spine. Any injury to this structures involving the tissue may cause functional instability of the spine. Excessive loading to the area may cause weak muscular control, leading to the disc no longer being able to provide optimal passive stiffness or stability.
- Thoacolumber fascia: this area provides a link between the lower and upper limb and works as a ‘retinacular strap’ of the muscles of the lumbar spine due to their orientation around the spine and acts as a activated proprioceptor. The thoracolumber fascia is built up of three layers anterior, middle and posterior layers.
- Paraspinals muscle: This component consist of the lumber extensor muscles, which includes two major groups; the erector spine and local muscles such as rotators and multifidus. The erector spine muscles are primarily thoracic muscles which have long moment arms that are ideal for lumbar spine extension. The local muscles acts as position sensors for the spinal segment and work as segmental stabilisers.
- Quadrratus Lumborum muscle: this is a large, thin, quadrangular muscle that has direct insertions to the lumbar spine and is a major stabilisers of the spine. Akuthota and Nadler state that is consist of three major components; the internal oblique, external oblique and longitudinal fascicles. The external oblique muscles acts eccentrically in lumber extension and lumbar torsion..Exercises such as isometric or eccentric trunk twists can be performed to strengthen this muscle and aid in stability and strength.
- Hip girdle musculature: The hip girdle area has a significant role within the kinetic chain in transferring force from the lower extremities to the pelvis and spine. Studies using people with LBP have identified poor endurance and delayed firing of the hip extensor (gluteus maximus) and abductor (gluteus medius) muscles, implying that these muscles also have a role in spinal stability.
- Diaphragm and pelvic floor muscles: the diaphragm and pelvic floor muscles play a role in spinal stability. Studies have identified that inspiration and expiration during breathing and the subsequent movement of the diaphragm has an important effect on achieving stability of the spine.
Need of the study
Low back pain remains a common disabling condition (Bogduk and Mcguirk 2002 Walker et al., 2004), with a lifetime prevalence of 60-90% and an annual incidence of 5%. No population appears immune. Up to 35% of sedentary workers and 47% of physical laborers’ relate a history of low back pain. The cause of low back pain among 95% of population is mechanical and (Hollingworth et al., 2002).[9]Work-related injuries are related to lumbar spine, and more than one-third of the costs for work injury claims are due to lumbosacral spine problems.
Physical therapy plays a major role in the management of mechanical low back pain. Even though many physiotherapy interventions like exercise, modalities, bracing, massage therapy, ergonomics, and postural advises exists; there is still a need for an effective relief from mechanical low back pain.[4] Among subjects experiencing Mechanical Low back Pain, 90% have the possible recurrence of symptoms in their life due to improper follow up of Good posture, Exercises and Ergonomics. Mechanical back pain could be to any sort of back pain caused by inserting abnormal stress and strain on muscles of the backbone. Typically, mechanical pain results from dangerous habits, like poor posture, poorly designed seating, and incorrect bending and lifting motions. Mechanical low back pain (LBP) remains a vital health drawback and a serious explanation for incapacity within the operating age, and in most of the cases, there is no clear underlying pathology. There are several factors inflicting mechanical low back pain, like excessive masses to normal spinal structures. The loads transmitted to the spine are affected by posture, body mechanics, trunk strength, and also flexibility in addition to strength of the muscles of the pelvic arch and lower extremities. Exercises could be a treatment of selection of LBP that specializes in sustained posture or continual movement, which will cause marvelous improvement in pain intensity.
Muscle energy technique decreasing pain, improvement of body part quality, and return to normal functioning in daily activities. Muscle energy technique is an associate degree of osteopathic manipulation. The muscles of patients were used, on request, to type a singular controlled position, in a very specific direction, and against a distinctly executed therapist- applied counterforce. Muscle energy technique could be a post-isometric relaxation, because it reduces the tone of a muscle or cluster of muscle after a brief period following an isometric contraction. This study was designed to check the effectiveness of muscle energy technique and soft tissue massage technique in rising pain, practical incapacity, and lumbar spine quality in patients with mechanical low back pain.(9)
The improvement in the mechanical low back pain was stressed in the study with the use of muscle energy techniques and soft tissue massage techniques. The need of the study was to evaluate the effect of the muscle energy techniques and soft tissue massage techniques on mechanical low back pain. MET is found to be effective in reducing lumbopelvic pain as a sole treatment and reducing disability in MLBP when combined with neuromuscular re- education and resistance training. A recent systematic review done on MET concluded that MET is effective in the treatment of LBP. MET is a versatile technique traditionally used to muscular strain, pain, local oedema and joint dysfunction and to improve functional disability to relieve muscle tension and increase the strength of the muscle. Morre described it as the “application of an accurately determined and specifically directed manual force to the body, in order to improve mobility in areas that are restricted in a joint connective tissue or in skeletal muscle(15) Massage therapy aims to stimulate the proprioceptive receptors of the skin and underlying tissues through touch and pressure and is believed to improve mechanical function of the musculoskeletal system. It has been proposed to increase the extensibility of soft tissue including muscle, tendon, fascia, the joint capsule and ligaments, by preventing the formation of fibrosis and adhesion.(10)
Aim of the study:
To compare the effectiveness of Muscle energy technique and soft tissue massage technique for improvement of pain and functional disability on mechanical low back pain patients.
Objectives of the study:
1. To evaluate the effects of muscle energy technique for improvement of pain and functional disability on mechanical low back pain patients.
2. To evaluate the effect of soft tissue massage technique for improvement of pain and functional disability on mechanical low back pain patients.
3. To compare the effectiveness between muscle energy technique and soft tissue massage technique for improvement of pain and functional disability on mechanical low back pain patients.
4. To find out the new facts about the physiotherapy techniques are going to be used in this study if present at any point.
Hypothesis
Alternative Hypothesis:
It states that there is significant difference between effects of muscle energy technique and soft tissue massage technique for improvement of pain and functional disability on the mechanical low back pain patients.
Null Hypothesis:
It states that there is no significant difference between effects of muscle energy technique and soft tissue massage technique for improvement of pain and functional disability on the mechanical low back pain patients.
METHODOLOGY
- STUDY DESIGN: Comparative study
- SAMPLE DESIGN: Randomized
- SAMPLE SIZE: 30 patients diagnosed with Mechanical low back pain.
- STUDY CENTER: GBH American hospital 101, Kothi Bagh ,Bhat Ji Ki Bari, Udaipur(raj.)
- DURATION OF THE STUDY: 20Weeks, 15 minute session per day, 5 day/weeks
INCLUSION CRITERIA:
- Age between 30-50 years
- Both male and female patients
- Diagnosed Mechanical Low Back Pain
EXCLUSION CRITERIA:
- Patient with widespread neurological symptoms
- Recent traumatic injury.
- Spinal tumor and stenosis
- Spinal surgery
- Any metal implants
- Vertebral compression fracture
- Ankylosing spondylitis ,spondylolysis
- Patient less than 30 yrs and above 50yr
OUTCOME MEASURES
- Visual analog scale(VAS)
- Oswestry low back pain disability questionnaire (OLBPDQ)
STUDY MATERIALS:
- Consent form
- Assessment form
- Data collection sheet
- Pillow
- Paper
- Pen
- Pencil
- Couch
- Lubricant oil
- Scale
- Cotton
PROCEDURE: After the 30 patients were selected through inclusion and exclusion criteria and after receiving the consent form they were divided into 2 groups each consisting of 15 patients receiving the intervention for 20weeks. The first group A was treated with muscle energy technique and group B was treated with soft tissue massage technique. .
GROUP A:
Post isometric relaxation procedure (PIR) was used as Muscle energy technique (MET)(19) to patient’s group of muscles to lengthen a shortened or contracted muscle, and to mobilize restricted articulation into its proper position. The effects of MET may involve a variety of biomechanical mechanisms such as the change in tissue fuids, altered proprioceptions, motor programming and control and neurophysiologic responses. The basic concept of PIR is to contract the tense muscle isometrically and then to encourage it to lengthen during a period of complete voluntary relaxation. Gravity is used to encourage release of muscle tension and taken up the slack. These studies have been done in mechanical LBP patients
The post isometric relax technique(PIR)(20) principle is followed in muscle energy technique. The Post isometric relax technique group also showed improvement in lumbar flexibility. Post isometric relaxation (PIR) exercise helps in contraction and relaxation method as well as facilitation an inhibition of muscles that accompanies breathing. PIR helps in flexibility of muscle because of its contraction and relaxation method.(20)
The patient made to sit at the edge of a table, the non tested leg kept leg in flexion at both hip and knee and the experimental limb to hang. Extend the knee of the opposite thigh up to the barrier. Then the patient is asked to flex the hip against minimal resistance and to breathe in for 10 seconds. The patient is then told to ’let go’ (relax) and exhale slowly. Wait for 10 to 20 seconds or longer as long as relaxation is taking place.

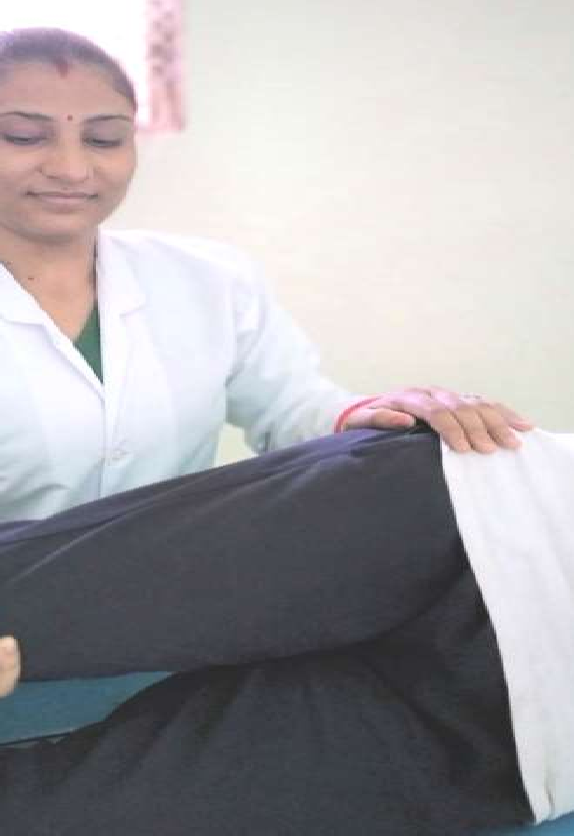

Muscle energy technique
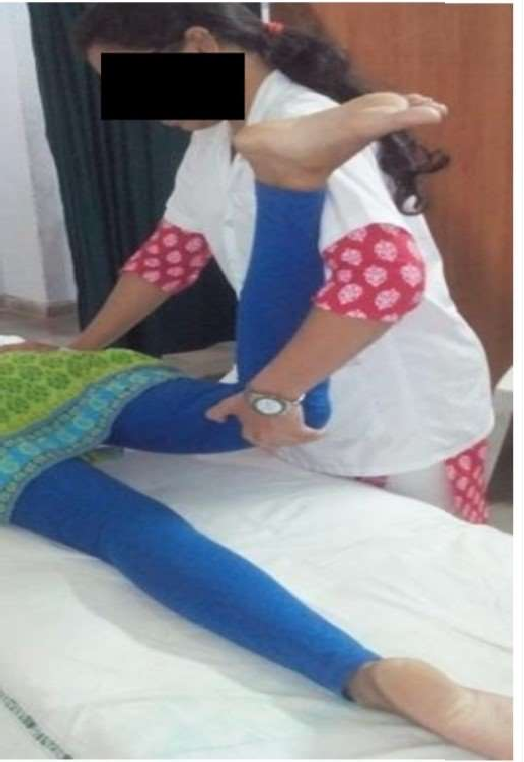
Muscle energy technique
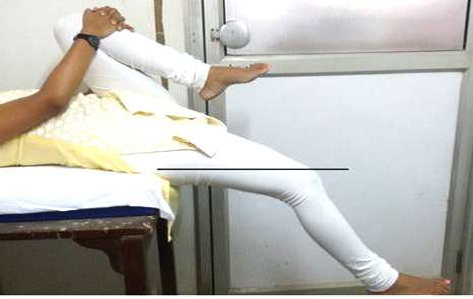
Post isometric relax technique
GROUP B:
Soft tissue massage technique applied for back muscles such as erector spine, multifidus
quadretus lumborum internal technique are –
and external oblique for 15 miutes. The
soft tissue mssage
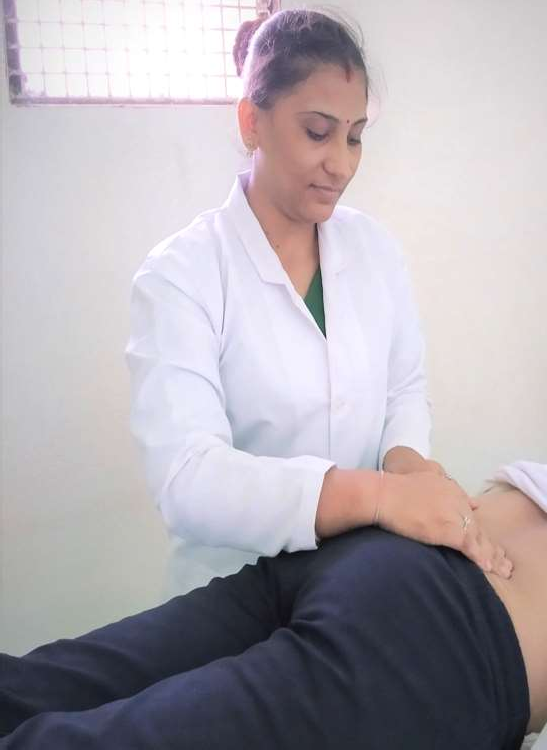

SOFT TISSUE MASSAGE TECHNIQUE


Thumb Kneading massage

Fingers Kneading Massage
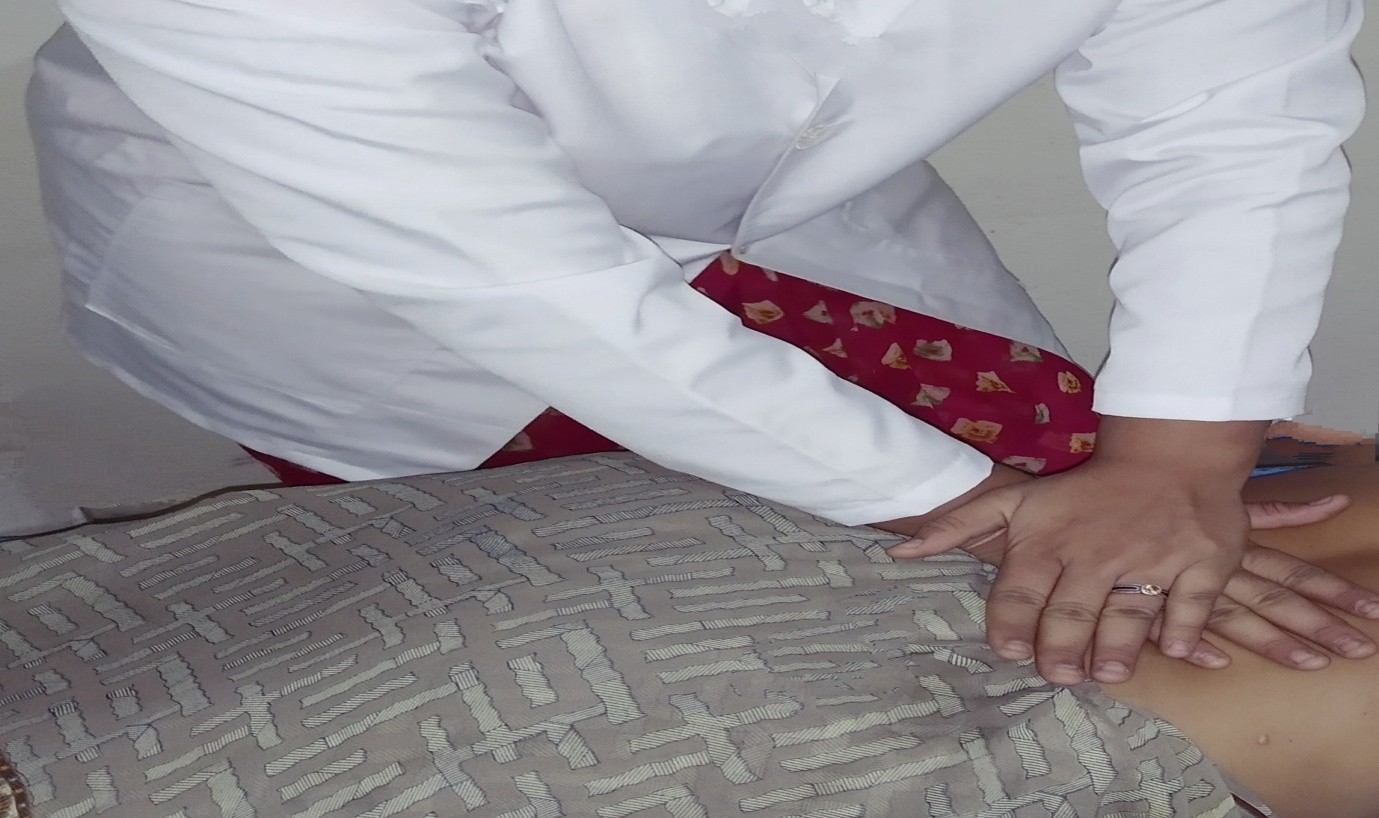
Vibration massage
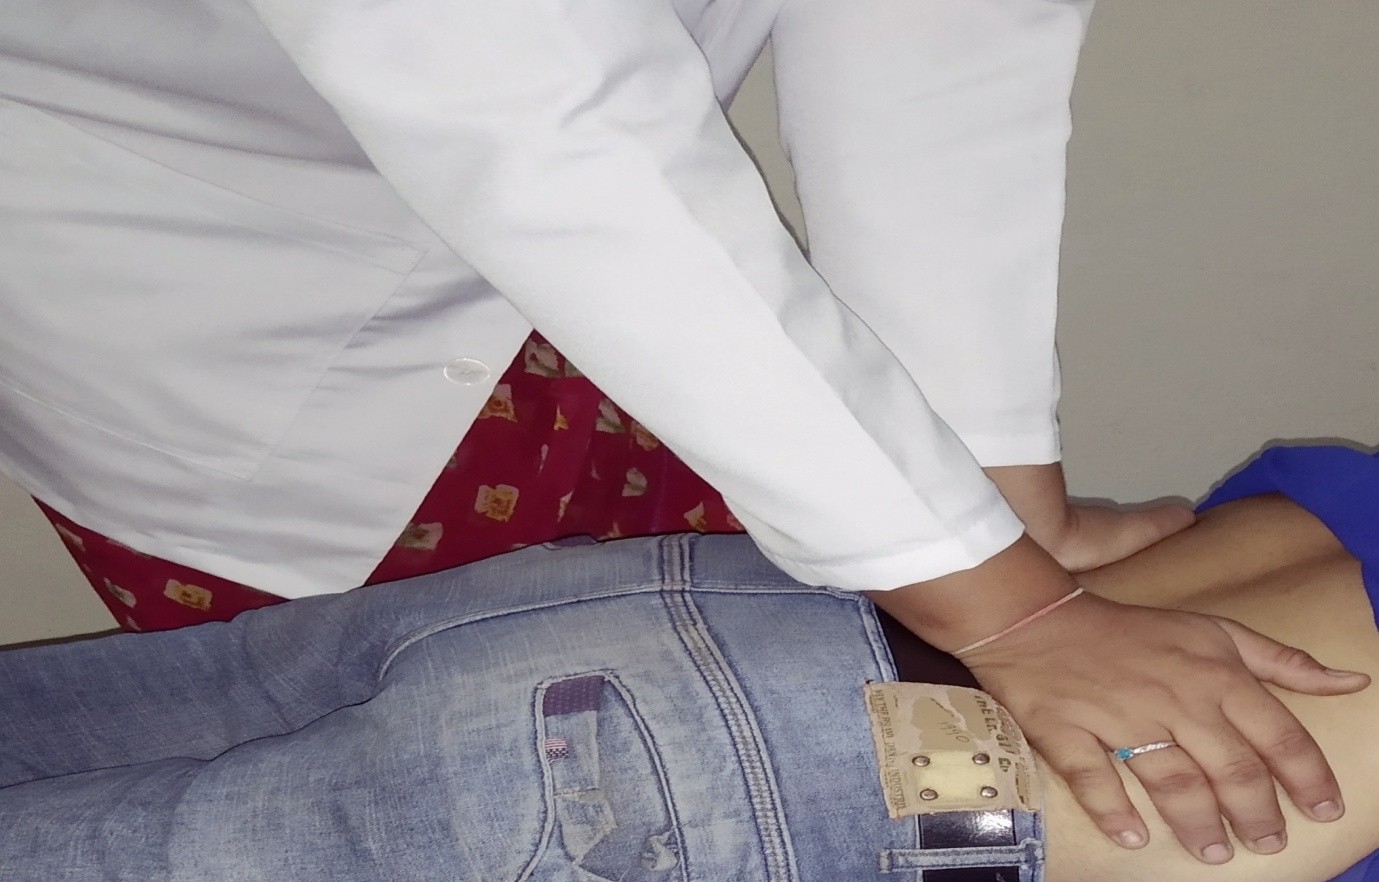
Effleurage Massage
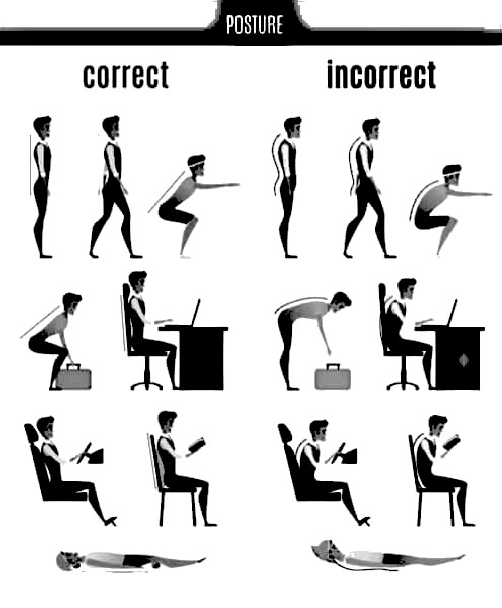
GOOD AND BAD POSTURES FOR REDUCE LOW BACK PAIN
FLOW CHART
GROUP A 15
GROUP B 15
Outcome Measures VAS, OLBPDQ
Outcome Measures VAS, OLBPDI
PRE- TEST SCORE VAS:
OLBPDI:
PRE – TEST SCORE VAS:
OLBPDI:
POST- TEST SCORE VAS:
OLBPDI:
POST- TEST SCORE VAS:
OLBPDI:
DATA COLLECTION
DATA ANALYSIS
RESULT
CONCLUSION
RESULTS AND DATA INTERPRETATION
The present study was carried out to compare the efficacy of Muscle Energy Technique (MET) and Soft Tissue Massage Technique for improvement of pain and functional disability on Mechanical Low Back Pain in patients. The present study examined the cause of MLBP in patients, intensity of low back pain by VAS, and functional disability using Oswestry Low Back Pain Disability Questionnaire (OLBPDQ) and comparison of both the technique on effectiveness on mechanical low back pain patients. The data obtained during the study was tabulated and statistically analyzed for interpretation of the result. The findings of the presents study have been presented and discussed in this chapter under the following major holdings.
- Demographic presentations of data
- Analysis of pre and post test values of Visual Analog Scale (VAS) within group A.
- Analysis of pre and post test values of Visual Analog Scale (VAS) within group B.
- Analysis of pre and post test values of Oswestry Low Back Pain Disability Questionnaire (OLBPDQ) within group A.
- Analysis of pre and post test values of Oswestry Low Back Pain Disability Questionnaire (OLBPDQ) within group B.
- Analysis of pre and post test values of Visual Analog Scale (VAS) between groups.
- Analysis of pre and post test values of Oswestry Low Back Pain Disability Questionnaire (OLBPDQ) between groups.
- Mean improvement in all the parameters between groups.
- DEMOGRAPHIC PRESENTATIONS OF DATA IN GROUPS:
GROUP 1
GROUP 2
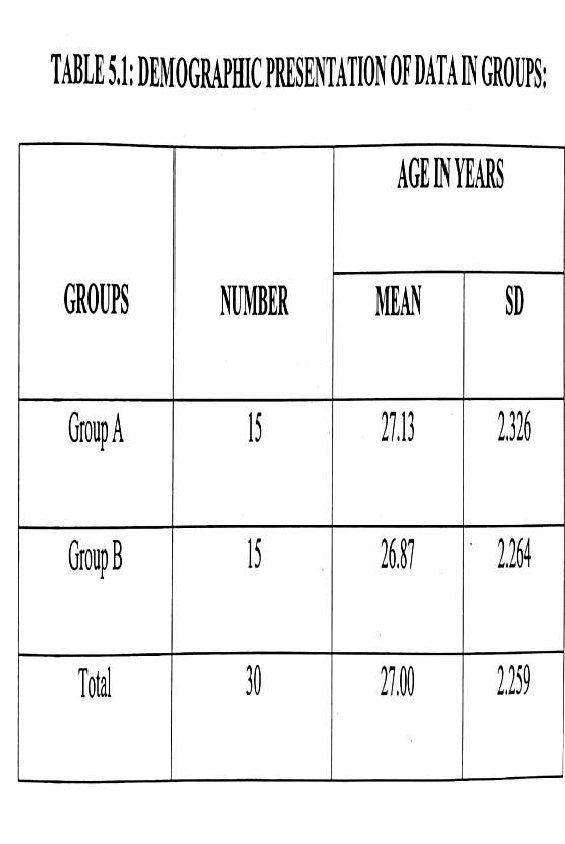
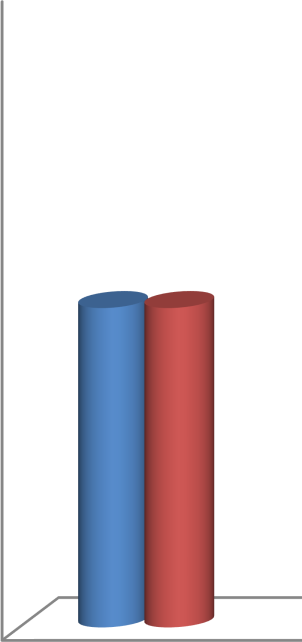
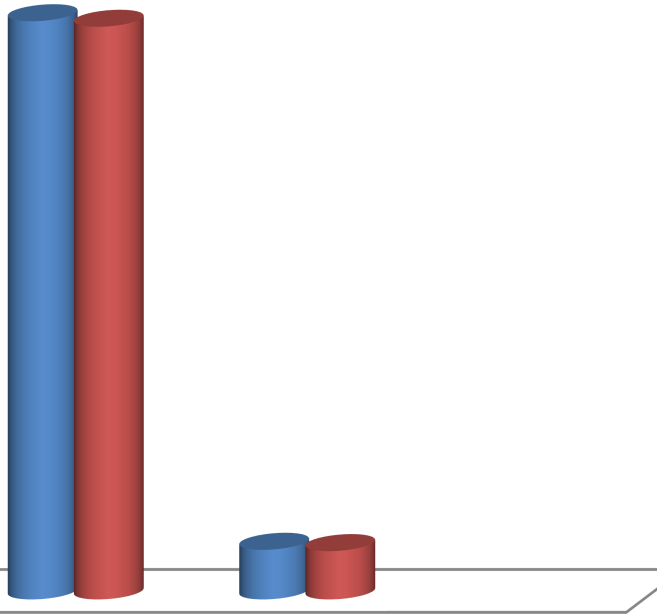
30
27.13 26.87
25
20
15
15
15
10
5
2.326 2.264
0
NUMBER
MEAN
SD
DEMOGRAPHIC PRESENTATIONS OF DATA IN GROUPS
INTERPRETATION
30 patients with diagnosed mechanical low back pain of age group between 30-50 yrs were
randomly selected according to inclusion and exclusion criteria and divided into two groups
with 15 patients in each groups. Group A had a mean age of 27.13 years and group B had a
mean age of 26.87 years. The demographic data has been presented in table 1 and figure 1
- ANALYSIS OF PRE AND POST TEST VALUES OF VISUAL ANALOG SCALE (VAS) WITHIN GROUP A:
The pain score of each patient in group A was assessed by using Visual Analogue Scale
before the start of the treatment as pre-test values and at the end of 20 weeks as post-test
values. The data has been presented in table 5.2 and depicted in figure 5.2.

FIGURE5.2: PRE – TEST
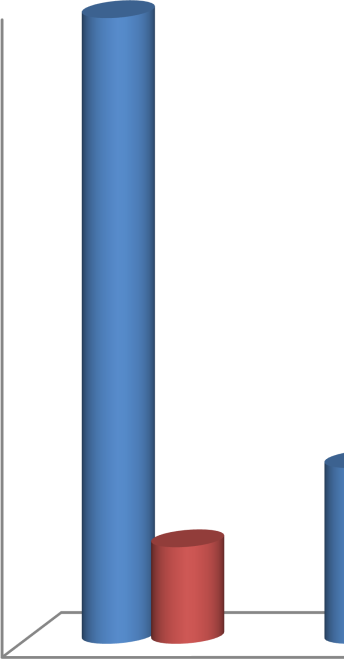
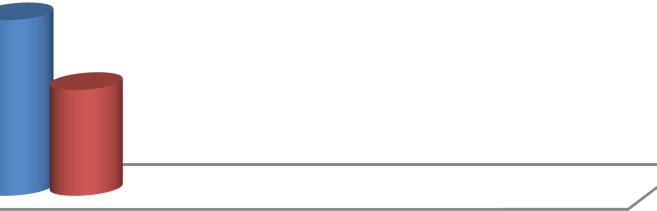
6.87
7
6
5
4
3
.93
2
1.06
1.163
1
0
PRE-TEST
POST TEST
AND POST TEST VALUES OF PAIN
SCORES USING
MEAN
SD
VISUAL ANALOG SCALE (VAS) WITHIN GROUP A:
1
INTERPRETATION:
The above table shows the mean of pre and post test values were 6.87 and 1.93, respectively.
The mean improvement in pain score of Group A was 4.94. The‘t’ value 17.373 and ‘p’ value
0.025 for pain score using VAS within Group A analysis. When compared to table values the
above ‘p’ values is lessor at p< 0.05, which is highly significant, it indicates that group A
treated with MET had significant improvement in in pain intensity within group A.
- ANALYSIS OF PRE
AND POST TEST VALUES OF
PAIN SCORES
USING VISUAL ANALOG SCALE (VAS) WITHIN GROUP B:
The pain score of each patient in group B was assessed by using Visual Analogue Scale
before the start of the treatment as pre-test values and at the end of 20 weeks as post-test
values. The data has been presented in table 5.3 and depicted in figure 5.3.
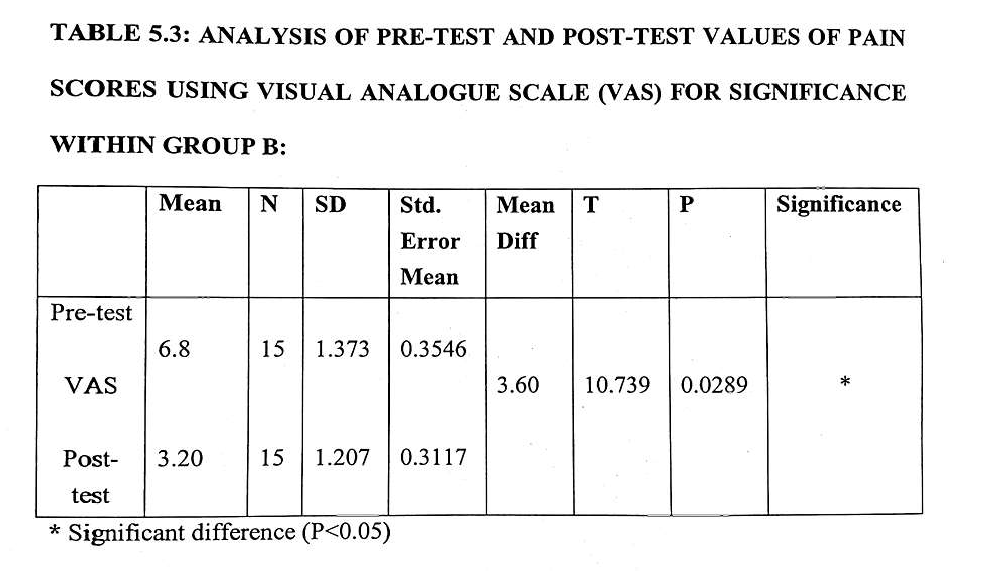
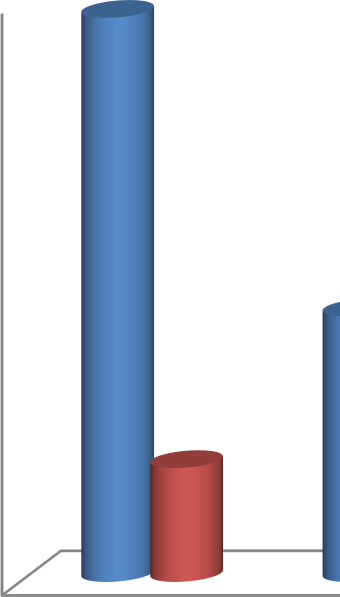

6.8
7
6
5
4
3.2
3
2
1.373
1.207
1
0
PRE-TEST
POST TEST
MEAN
SD
FIGURE 5.3: PRE-TEST
AND POST TEST VALUES OF PAIN
SCORES USING
VISUAL ANALOGUE SCALE (VAS) WITHIN GROUP B:
INTERPRETATION:
The above table shows the mean of pre and post test values were 6.8 and 3.2, respectively.
The mean improvement in pain score of Group B was 3.6. The‘t’ value 10.739 and ‘p’ value
0.0289 for pain score using VAS within Group B analysis. When compared to table values
the above ‘p’ values is lessor at p< 0.05, which is highly significant, it indicates that group B
treated with MET had significant improvement in in pain intensity within group B.
- ANALYSIS OF PRE AND POST TEST VALUES OF DISABILITY
SCORES USING OLBPQ FOR SIGNIFICANCE WITHIN GROUP A.
The functional disability score of each patient in group A was assessed by using Oswestry
Low Back Pain Disability Questionnaire (OLBPDQ) before the start of the treatment as pre-
test values and at the end of 20 weeks as post-test values. The data has been presented in table
- and depicted in figure 5.4.
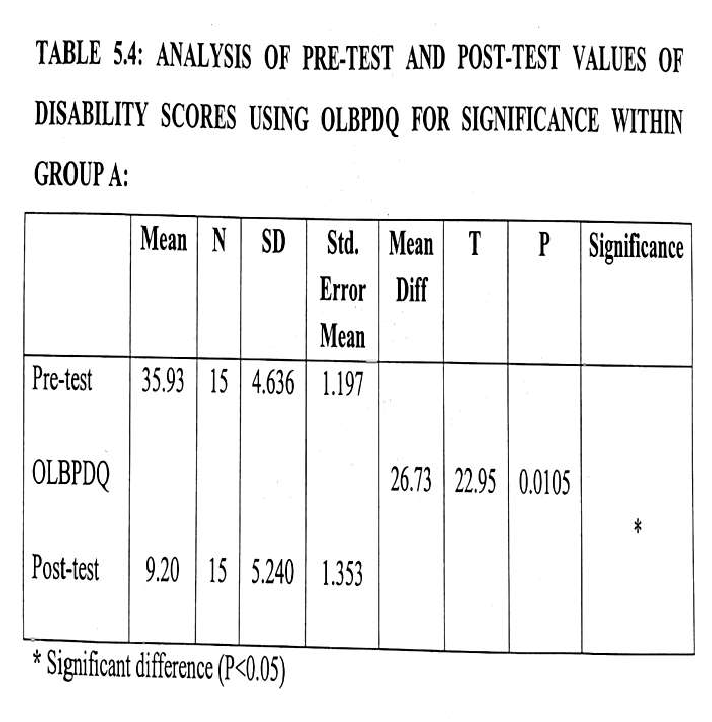

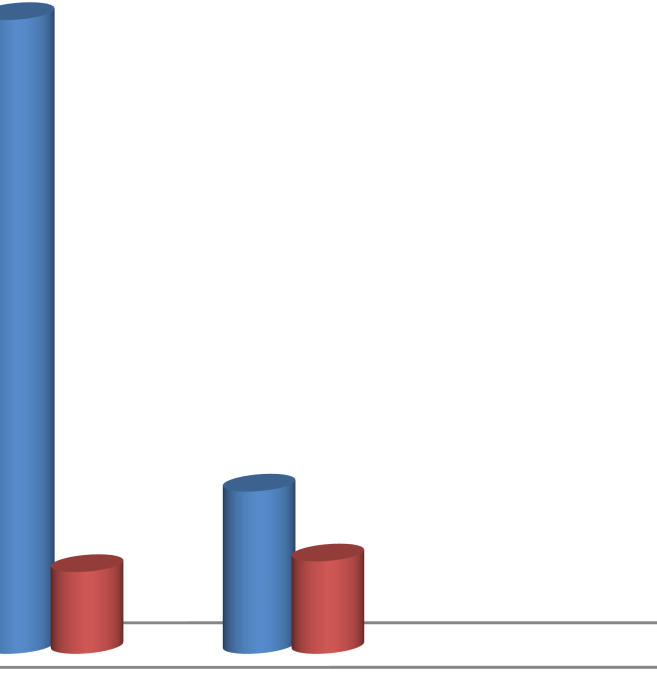
40
35.93
35
30
25
20
15
9.2
10
4.636
5.24
5
0
PRE-TEST
POST TEST
FIGURE 5.4: PRE AND POST TEST VALUES OF FUNCTIONAL DISABILITY SCORES USING OLBPQ WITHIN GROUP A:
MEAN
SD
INTERPRETATION:
The above table shows the mean of pre and post test values were 35.93 and 9.20,
respectively. The mean improvement in pain score of Group A was 26.73. The‘t’ value 22.95
and ‘p’ value 0.0105 for functional disability score using OLBPDQ within Group A
analysis. When compared to table values the above ‘p’ values is lessor at p< 0.05, which is
highly significant, it indicates that group A treated with MET had significant improvement in
in pain intensity within group B.
- ANALYSIS OF PRE AND POST TEST VALUES OF DISABILITY
SCORES USING OLBPDQ FOR SIGNIFICANCE WITHIN GROUP A.
The functional disability score of each patient in group A was assessed by using Oswestry
Low Back Pain Disability Questionnaire (OLBPDQ) before the start of the treatment as pre-
test values and at the end of 20 weeks as post-test values. The data has been presented in table
- and depicted in figure 5.5.
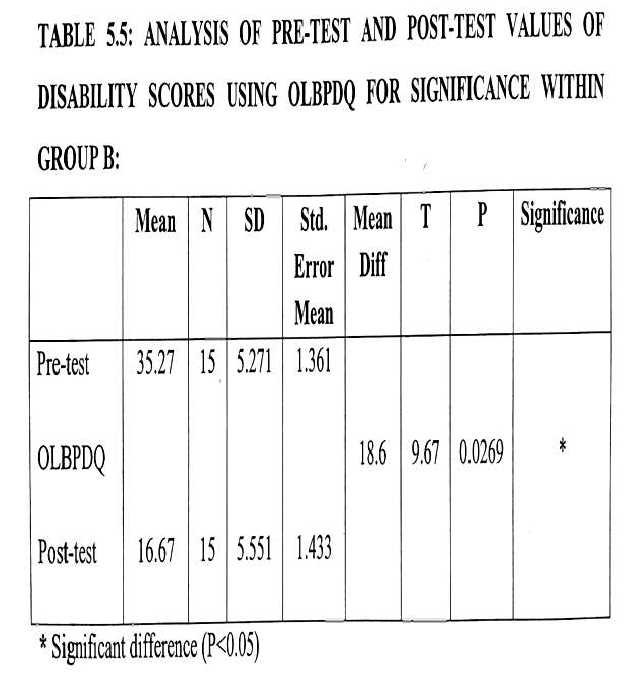

40
35.27
35
30
25
20
16.67
15
10
5.271
5.551
5
0
PRE-TEST
P ST TEST
MEAN
SD
FIGURE 5.5: PRE AND POST TEST VALUES OF FUNCTIONAL DISABILITY
O
SCORES USING OLBPDQ WITHIN GROUP B:
INTERPRETATION:
The above table shows the
mean of pre and post test values were
35.27 and 16.67,
respectively. The mean improvement in pain score of Group A was 18.6. The‘t’ value 9.67
and ‘p’ value 0.0269 for functional disability score using OLBPDQ within Group A analysis.
When compared to table values the above ‘p’ values is lessor at p< 0.05, which is highly
significant, it indicates that group A treated with Soft MET had significant improvement in
pain intensity within group B.
- ANALYSIS OF PRE TEST VALUES OF PAIN SCORES USING VISUAL ANALOG SCALE (VAS) BETWEEN GROUPS:
The pain score of each patient in group A and group B were assessed by using Visual
Analogue Scale before the start of the treatment as pre-test values. The values of group A and
group B were compared between groups for significance of treatment. The data has been
presented in table 5.6 and depicted in figure 5.6.
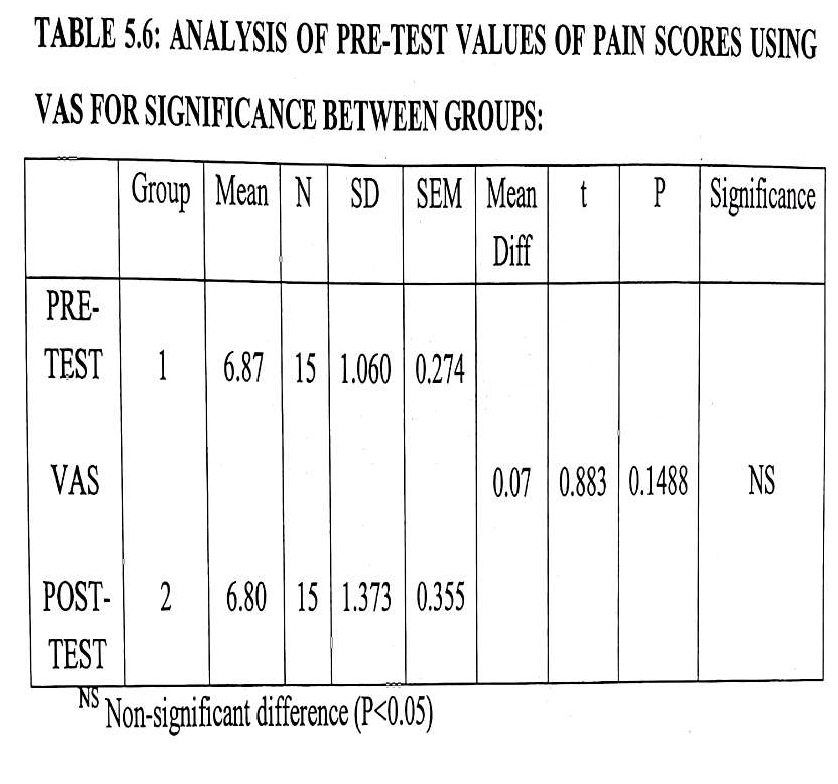
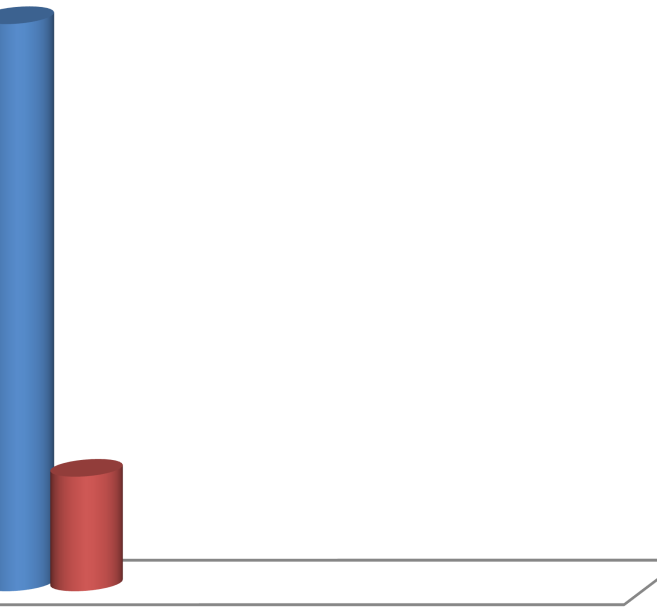
6.87
6.8
7
6
5
4
3
2 1.373
1.06
1
0
GROUP 1
GROUP 2
FIGURE 5.6: PRE-TEST VALUES OF PAIN SCORES USING VISUAL ANALOGUE
SCALE (VAS) BETWEEN GROUPS:
MEAN
SD
INTERPRETATION:
The above table shows the mean of pre test values were 6.87 and 6.80 in group A and group
B. The mean improvement in pain score of Groups were 0.07. The‘t’ value 0.883 and ‘p’ value 0.1488 for pain scores between group A and group B analysis. When compared to table values the above ‘p’ values is greater at p< 0.05, which is non significant, it indicates that Homogeneity in pre test of the groups.
- ANALYSIS OF POST TEST VALUES OF PAIN SCORES USING VISUAL ANALOG SCALE (VAS) BETWEEN GROUPS:
The pain score of each patient in group A and group B were assessed by using Visual
Analogue Scale at the end of 20 weeks as post-test values. The values of group A and group B
were compared between groups for significance of treatment. The data has been presented in
table 5.7 and depicted in figure 5.7.
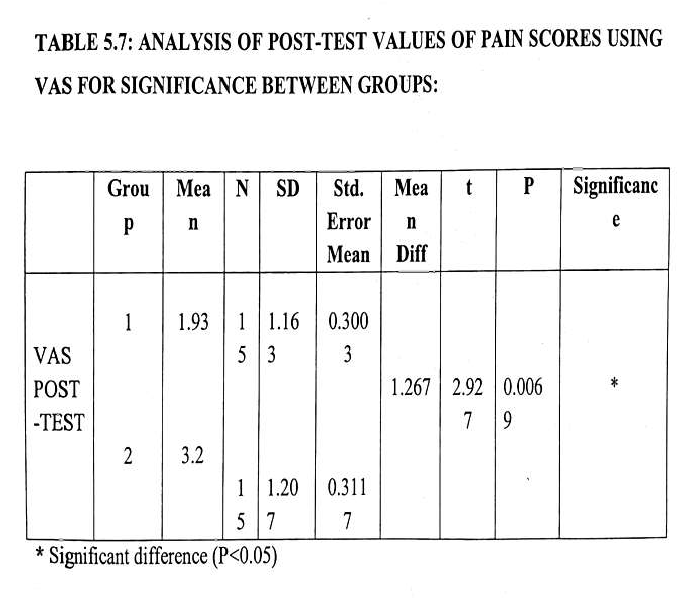

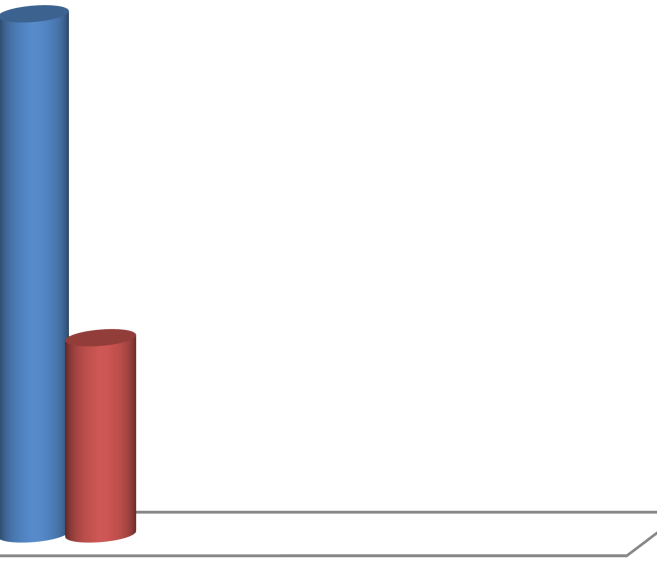
3.5
3.2
3
2.5
1.93
2
1.5
1.163
1.207
1
0.5
0
GROUP 1
GROUP 2
FIGURE 5.7: POST-TEST VALUES OF PAIN SCORES ANALOGUE SCALE (VAS) BETWEEN GROUPS:
MEAN
SD
USING VISUAL
INTERPRETATION:
The above table shows the mean of post test values were 1.93 and 3.2 in group A and group
B. The mean improvement in pain score of Groups were 1.267. The‘t’ value 2.927 and ‘p’
value 0.0069 for pain scores between group A and group B analysis. When compared to table
values the above ‘p’ values is lesser at p< 0.05, which is significant, it indicates that both the
techniques were effective in low back pain treatment but group A treated with MET has
superior effect than group B treated with Soft Tissue Massage Technique in low back pain.
- ANALYSIS OF PRE TEST VALUES OF FUNCTIONAL DISABILITY SCORES USING OLBPDQ BETWEEN GROUPS:
The functional disability score of each patient in group A and group B were assessed by using
Oswestry Low Back Pain Disability Questionnaire (OLBPDQ) before the start of the
treatment as pre-test values. . The values of group A and group B were compared between
groups for significance of treatment. The data has been presented in table 5.8 and depicted in
figure 5.8.

3
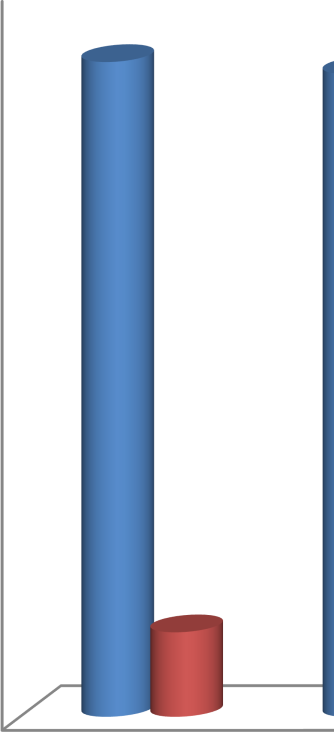
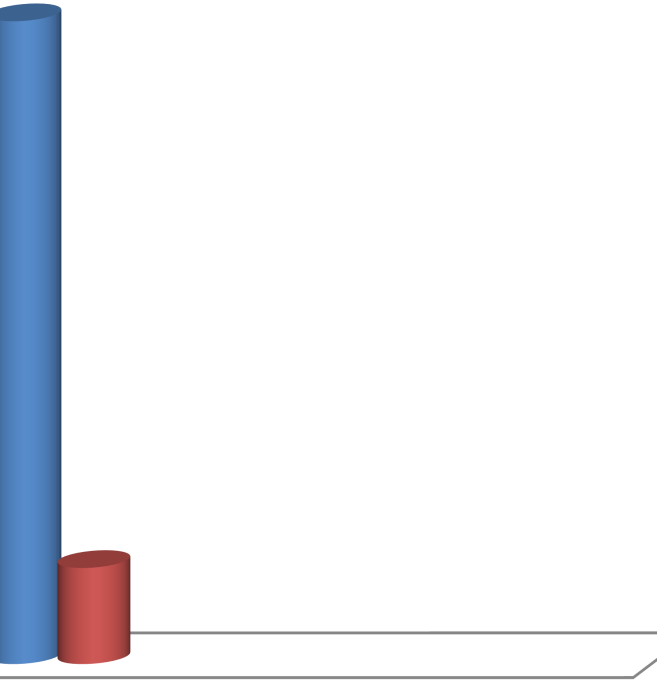
40
35.93
5.27
35
30
25
20
15
10
4.636
5.271
5
0
GROUP 1
GROUP 2
MEAN
SD
FIGURE 5.8: PRE-TEST VALUES OF FUNCTIONAL DISABILITY SCORES USING OLBPDQ BETWEEN GROUPS:
INTERPRETATION:
The above table shows the mean of pre test values of functional disability score were 35.93
and 35.27 in group A and group B. The mean improvements in functional disability score
between Groups were 0.66. The‘t’ value 0.3678 and ‘p’ value 0.7159 for functional disability
score between group A and group B analysis. When compared to table values the above ‘p’
values is greater at p< 0.05, which is non significant, it indicates that homogeneity in pre test
values of both the groups but group A treated with MET and group B treated with Soft Tissue
Massage Technique and pre test values showed insignificant effect with each other.
9 ANALYSIS OF POST TEST VALUES OF FUNCTIONAL DISABILITY SCORES USING OLBPDQ BETWEEN GROUPS:
The functional disability score of each patient in group A and group B were assessed by using
Oswestry Low Back Pain Disability Questionnaire (OLBPDQ) before the start of the
treatment as post-test values. . The values of group A and group B were compared between groups for significance of treatment. The data has been presented in table 5.9 and depicted in figure 5.9.
MEAN
SD
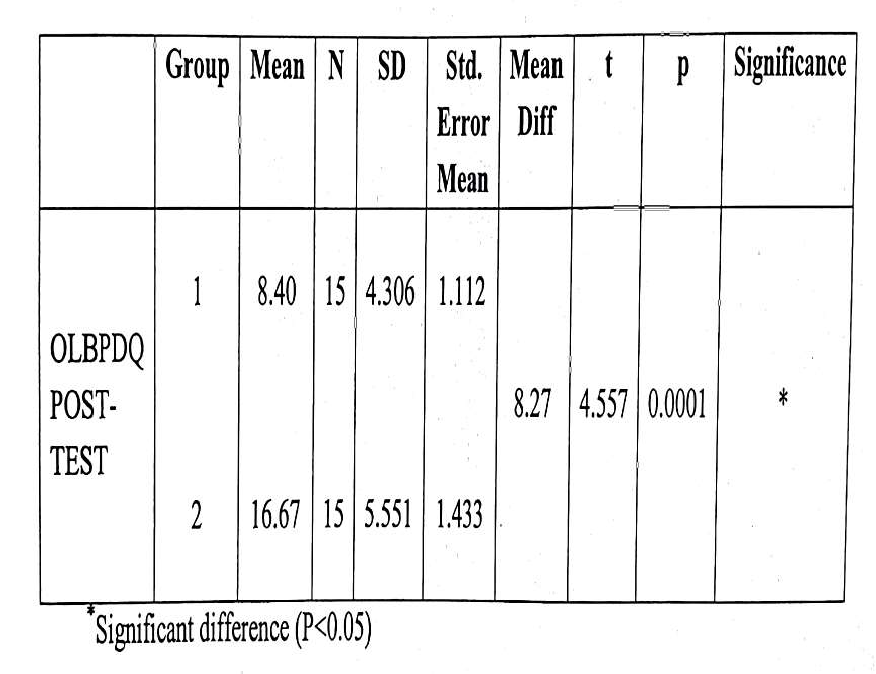
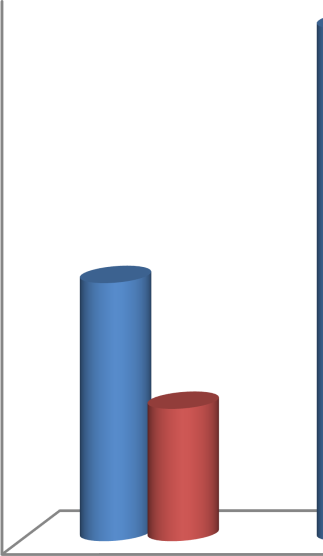
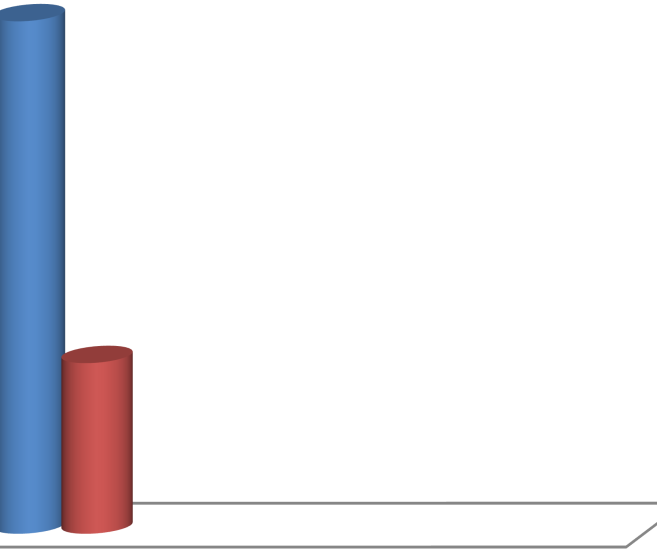
16.67
18
16
14
12
10
8.4
8
5.551
6
4.306
4
2
0
GROUP 1
GROUP 2
FIGURE 5.9: POST-TEST VALUES OF FUNCTIONAL DISABILITY SCORES USING OLBPDQ BETWEEN GROUPS:
INTERPRETATION:
The above table shows the mean of post test values of functional disability score were 8.40
and 16.67 in group A and group B. The mean improvements in functional disability score
between Groups were 8.27. The ‘t’value 4.557 and ‘p’ value 0.0001 for functional disability
score between group A and group B analysis. When compared to table values the above ‘p’
values is lesser at p< 0.05, which is significant, it indicates that both the techniques were
effective in improving in functional ability in low back pain treatment but group A treated
with MET has superior effect than group B treated with Soft Tissue Massage Technique in
mechanical low back pain.
10. MEAN IMPROVEMENT IN ALL THE PARAMETERS BETWEEN GROUPS A AND GROUP B:
The pain and functional disability score of each patient in group A and group B were
assessed by using Visual Analogue Scale (VAS) and Oswestry Low Back Pain Disability
Questionnaire (OLBPDQ) before the start of the treatment as post-test values. . The values of
group A and group B were compared between group for significance of treatment. The data
has been presented in table 5.10 and depicted in figure 5.10.
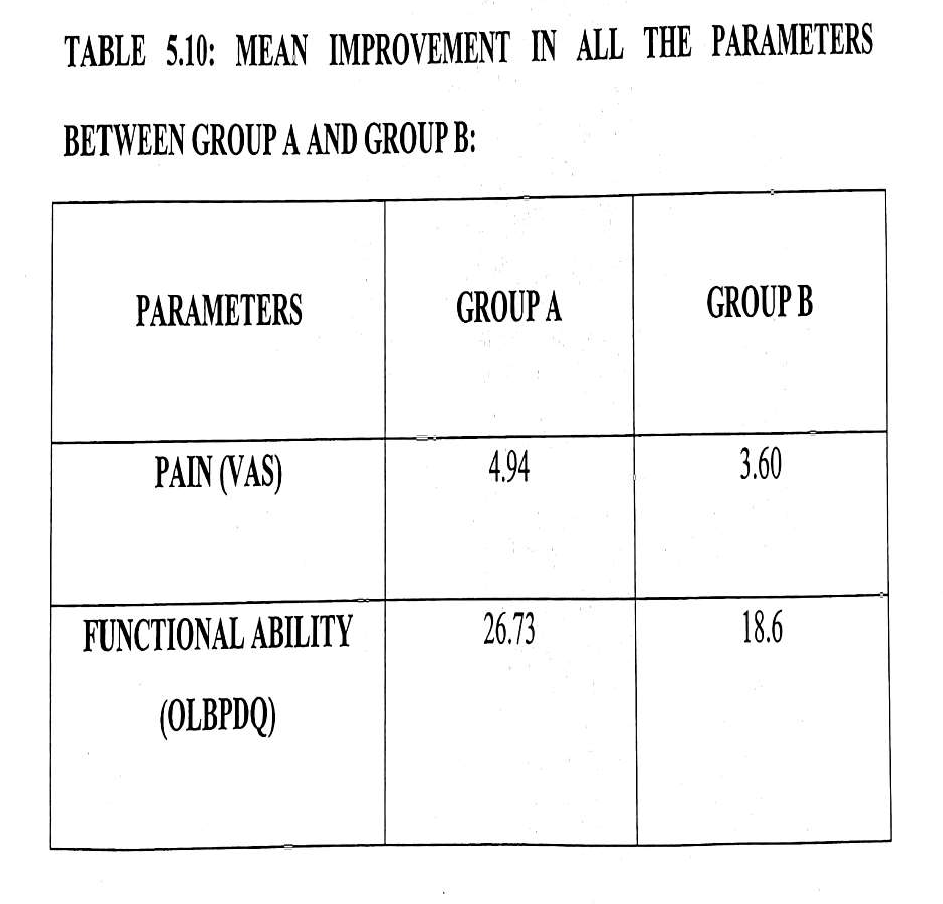

30
26.73
25
18.6
20
15
10
4.94
3.6
5
0
Pain
Functional ability
MEAN
SD
FIGURE 5.10: MEAN IMPROVEMENT IN PAIN AND FUNCTIONAL DISABILITY PARAMETERS BETWEEN GROUP A AND GROUP B:
INTERPRETATION:
The above table shows the mean improvement in pain score of VAS was 4.94 in group A and
3.60 in group B. it was resulted that group A treated with MET has superior effect in pain score than group B treated with Soft Tissue Massage Technique in low back pain in patients. The above table shows the mean improvement in functional disability score of OLBPDQ was
26.73 in group A and 18.6 in group B. It was resulted that group A treated with MET has superior effect in pain score than group B treated with Soft Tissue Massage Technique in low back pain in patient.
The results of this study support MET and STMT which can be effective in reducing pain and
improving the range of motion patients suffering from MLBP. Paired t test was performed to
analyze the efficiency of treatment within the groups and unpaired t test was performed to
analyze the efficiency of treatment between both groups. The pain score of each patient in
group B was assessed by using Visual Analogue Scale before the start of the treatment as pre-
test values and at the end of 20 weeks as post-test values. The mean of pre test and post test
values were 6.87 and 1.93
respectively in group A and 6.8 and 3.2
in group B.
DISSCUSSION:
Pain intensity level: both MET and STMT groups revealed a statistical significant reduction in pain intensity level after the intervention period in patient with MLBP. For PIR group, the analgesic effect of PIR could be explained by both spinal and supraspinal mechanisms; Activation of both muscle and joint mechanoreceptors occurs during an isometric contraction. This leads to sympatho-excitation evoked by somatic efferents and localized activation of the periaqueductal grey that plays a role in descending modulation of pain. PIR stimulates joint proprioceptors, via the production of joint movement, or the stretching of a joint capsule. The effect of STMT could be explained by both spinal and supraspinal mechanisms; Activation of muscle and joint occurs during sustained release.
Nociceptive inhibition then occurs at the dorsal horn of the spinal cord, as simultaneous gating takes place of nociceptive impulses in the dorsal horn, due to mechanoreceptor stimulation STMT procedures claim to encourage the circulation of fluid in and around the tissues to enhance venous and lymphatic systems and aid in decongesting areas of fluid stasis pain by inhibiting the smaller diameter nociceptive neuronal input at the spinal cord level.
Both MET and STMT groups showed a statistical significant improvement in lumbar spine after the intervention period in patient with MLBP. For MET group, The improvement is can be explained by reduction of pain and a proposed hypothesis.
For STMT group, The improvement is explained by reduction of pain and a proposed hypothesis The viscoelastic explanation for the palpable changes associated with fascial release enjoys widespread support. The theoretical base for chosen STMT technique was to free barriers within the deeper layers of fascia and the surrounding muscle fibers.
Through this process it was believed that there would be significant increase in and pain. Functional Disability: both MET and STMT groups revealed a statistical significant reduction in Function disability level after the intervention period in patient with MLBP. This improvement is the resultant of combined findings of pain reduction and increasing of lumbar spine mobility. MET group is supported by a study of Wilson (2003) concluded that using MET may benefit a patient to reduce low back pain and improve low back functional disabilities. Present study was done to evaluate the effectiveness of Muscle Energy Techniques (MET) and Soft Tissue Massage Technique in reducing pain and improving functional ability for patients with low back pain. Pre test data were collected at the beginning of the study and post test data were collected at the end of 20week. The data were statistically analysed and comparing group A and group B, both the group showed significant improvement in pain, Disability, but Group A not only showed greater improvement but also recorded a high degree of consistency with ‘t’ values and as seen in graph showing mean improvement of both the parameters. There is greater improvement in mean of pain, and Disability in Group B.
More frequently however, pain is the result of poor posture and excessive static strain. In present study, total 30 patients with low back pain were selected randomly and divided into two groups – Group A and Group B (15 patients in each group), who received Muscle Energy Technique (MET) and Soft Tissue Massage Technique (STMT), respectively. The group A had a mean age of 27.13 years and group B had a mean age of 26.87 years.The study, two groups were compared for the significant difference to evaluate the effectiveness of Muscle Energy Technique (MET) and Soft Tissue Massage Technique in reducing pain and improving functional ability for patient with low back pain. This study of 20weeks of MET & STMT technique was found to have significant improvement in low back pain.
The superior effect of MET group compared to STMT & control group is similar to finding of previous authors. MET reduces tension in the back muscles and subsequently decreases pain .The present study which is similar to the findings by Anderson.
This may be because MET stimulates muscle spindles & golgi tendon organs reducing excessive activity. The reduction in pain by MET is similar to the findings by lewit & simons & Brodinn.
CONCLUSION:
This study concluded that MUSCLE ENERGY TECHNIQUE is statistically more effective than SOFT TISSUE MASSAGE TECHNIQUE for improvement of pain and functional disability on mechanical low back pain patient.
REFERENCES
- Last AR, Hulbert K. Mechenical low back pain: Am Fam Physician. 2010;79(12):1067–1074.
- Crombez G, Vlaeyen JW, Heuts PH, Lysens R, Crombez G. Pain-related fear is more disabling than pain itself: evidence on the role of pain-related fear in chronic back pain disability. Pain. 1999;80(1-2):329–339.
- Morone G, Paolucci T, Alcuri MR, et al. Quality of life improved by multidisciplinary back school program in patıents with chronic nonspecific low back pain: a single blind randomized controlled trial. Eur J Phys Rehabil Med. 2011;47(4):533–541.
- Paolucci T, Morone G, Iosa M, et al. Psychological features and outcomes of the Back School treatment in patients with chronic non-specific low back pain. A randomized controlled study. Eur J Phys Rehabil Med. 2012;48(2):245–253.
- Henchoz Y, Kai-Lik So A, Henchoz Y. Exercise and nonspecific low back pain: a literature review. Joint Bone Spine. 2008;75(5):533–539.
- Hayden JA, Dunn KM, van der Windt DA, Shaw WS. Soft tissue massage technique Best Pract Res Clin Rheumatol. 2010;24(2):167–179.
- Lawand P, Lombardi Júnior I, Jones A, et al. Effect of a muscle stretching program using the global postural reeducation method for patients with chronic low back pain: A randomized controlled trial. Joint Bone Spine. 2015;82(4):272–277.
- muscles of the back and abdomen in low back pain Haghpanah SA, Ebrahimi Sport med 2014 ;56-80
- Garcìa AN, Costa L, Hancock MJ, et al. McKenzie Method of Mechanical Diagnosis and Therapy was slightly more effective than placebo for pain, but not for disability, in patients with chronic non-specific low back pain: a randomised placebo controlled trial with short and longer term follow-up. Br J Sports Med. 2018;52:594–600.
- Korovessis P, Stamatakis M, Baikousis A, Korovessis P. Segmental roentgenographic analysis of vertebral inclination on sagittal plane in asymptomatic vs chronic low back pain patients. J Spinal Disord. 1999;12(2):131, 137–7.
- Ebrahimi S, Kamali F, Razeghi M,. Comparison of the trunk-pelvis and lower extremities sagittal plane inter-segmental coordination and variability during walking in persons with and without chronic low back pain. Hum Mov Sci. 2017;52:55–66.
- Kamioka H, Tsutani K, Katsumata Y, et al. Effectiveness of Pilates exercise: A quality evaluation and summary of systematic reviews based on randomized controlled trials. Complement Ther Med. 2016;25:1–19.
- Moreno MA, Catai AM, Teodori RM, et al. Effect of a muscle stretching program using the Global Postural Reeducation method on respiratory muscle strength and thoracoabdominal mobility of sedentary young males. J Bras Pneumol. 2007;33(6):679–686.
- Castagnoli C, Cecchi F, del Canto A, et al. Effects in Short and Long Term of Global Postural Reeducation (GPR) on Chronic Low Back Pain: A Controlled Study with One-Year Follow-Up. ScientificWorldJournal. 2015;2015:1–8.
- Hasanpour-Dehkordi A, Dehghani A, Solati K. A Comparison of the Effects of Pilates and McKenzie Training on Pain and General Health in Men with Chronic Low Back Pain: A Randomized Trial. Indian J Palliat Care. 2017;23(1):36–40.
- Qaseem A, Wilt TJ, Mclean RM, Forciea MA. Clinical Guidelines Committee of the American College of Physicians. Noninvasive Treatments for Acute, Subacute, and Chronic Low Back Pain: A Clinical Practice-Guideline From the American College of Physicians. Ann Intern Med. 2017;166(7):514– 530.
- Wong JJ, Côté P, Sutton DA, et al. Clinical practice guidelines for the noninvasive management of low back pain: A systematic review by the Ontario Protocol for Traffic Injury Management (OPTIMa) Collaboration. Eur J Pain. 2017;21(2):201–216.
- Chaitow L. Muscle energy technique. Elsevier Science Health Science Division, 2013.
- Upson M. Last Updated: Aug 29, 2015. Post-isometric exercise relaxation techniques. http://www.livestrong.com accessed 2 january, 2017.
- National Institute for Health and Care Excellence . Clinical Guidelines. Low Back Pain and Sciatica in Over 16s: Assessment and Management. National Guideline Centre (UK) London: National Institute for Health and Care Excellence; 2016.
- Delitto A, George SZ, van Dillen L, et al. Low Back Pain. Clinical Practice Guidelines Linked to the International Classification of Functioning, Disability, and Health from the Orthopaedic Section of the American Physical Therapy Association. J Orthop Sports Phys Ther. 2012;42(4):A1–57.
- Negrini S, Giovannoni S, Minozzi S, et al. Diagnostic therapeutic flowcharts for low back pain patients: the Italian clinical guidelines. Eura Medicophys. 2006;42(2):151–170.
- Santilli V, et al. Linee guida ed evidenze scientifiche in medicina fisica e riabilitativa. Universit degli Studi di Roma. La Sapienza. 2017:265–298’
- Garcia AN, Costa LC, da Silva TM, et al. Effectiveness of back school versus McKenzie exercises in patients with chronic nonspecific low back pain: a randomized controlled trial. Phys Ther. 2013;93(6):729–747.
Manuscript
The present study was done to evaluate the effectiveness of Muscle Energy Techniques (MET) and Soft Tissue Massage Technique in reducing pain and improving functional ability for patients with low back pain.
In present study, total 30 patients with low back pain were selected randomly and divided into two groups – Group A and Group B (15 patients in each group), who received Muscle Energy Technique (MET) and Soft Tissue Massage Technique (STMT), respectively for 20 weeks and data were collected at the beginning of the treatment and the end of the treatment.
The mean age of Group A and Group B was 27.13 and 26.87 years, respectively. Data were analyzed using paired and unpaired ‘t’ test which showed that both Muscle Energy Technique and Soft Tissue Massage Technique have got beneficial effect on reducing pain and disability on chronic low back pain in patients but when compared mean difference between two procedures for effectiveness, the result were significant for Muscle Energy Techniques. Thus present study accepts the experimental hypothesis.
The mean improvement in pain scores of VAS was 4.94 in Group A and 3.60 in Group B. it was resulted that Group A treated with MET had a superior effect in pain status over Group B treated with STMT in low back pain.
The mean improvement in functional ability scores of OLBPDQ was 26.73 in Group A and 18.60 in Group B. it was resulted that Group A treated with MET had a superior effect in functional ability status over Group B treated with STMT in low back pain in patients.
Hence Muscle Energy Technique is more effective than STMT on reducing pain and functional disability on chromic low back pain patient.
COMPARING THE EFFECTS OF SURYANAMASKAR VERSUS CORE STABILIZATION USING PILATES BALL ON WEIGHT REDUCTION AMONG COLLEGIATE PLAYERS.
Dr. Vinod Nair,
Assistant Professor
Dept. of Physiotherapy
J.R.N. Rajasthan Vidyapeeth Deemed to be University
Udaipur (Raj.)
ABSTRACT
Background: Obesity is defined by world health organization (WHO) as abnormal or excessive fat accumulation that presents a risk to health. A study analyzed the prevalence of obesity is 107.7 million in children and 603.7 million in adults over 70 countries between the year 1980 and 2015. Studies state that abdominal obesity is an emerging health problem, especially Indians are genetically susceptible to fat accumulation around the waist. Obesity as the serious problems of public health, since it considerably increases the risk of chronic diseases, such as cardiovascular diseases, stroke, diabetes, balancing difficulties and certain kinds of cancer. The purpose of the present study is to compare the effects of Suryanamaskar and Dynamic soft tissue mobilization on balance and weight reduction in obese collegiate players.
Aim: To compare the effectiveness of SURYANAMASKAR and CORE STABILIZATION on balance and weight reduction.
Methodology: The present study includes 30 students of both genders in the age group of 18- 24 years with BMI of above 30. The participants are allocated into two groups Group A (suryanamaskar) n=15, Group B (core stabilization) n=15. The intervention period for both the group is 6 weeks. The pre and post session outcome measures were taken using BMI, waist circumference and Y- Balance test.
Result: There was a significant improvement in the post session measures of BMI, waist circumference and Y- Balance test (p ≤ 0.0001). Conclusion: The present study concluded that both Suryanamaskar and Core stabilization shows significant improvement in reducing the weight and improving balance. But the mean difference shows there was more weight reduction in suryanamaskar group and balance is significantly improved in core stabilization group.
Key words: Suryanamaskar, Core stabilization, Waist circumference, BMI and Y- balance test.
INTRODUCTION:
Obesity is defined by world health organization (WHO) as abnormal or excessive fat accumulation that presents a risk to health. The most commonly used parameter to measure obesity is body mass index (BMI) it is calculated by the persons weight in kilogram divided by the square of the height in meters . A person with the BMI of 30 or more is generally considered as obese [1]. The guidelines of WHO state that alternative measures that reflect abdominal obesity is waist circumference (WC). In recent studies the data were analyzed using cut offs point for Asians as 90cm in men and 80 cm in women [2].
A study analyzed the prevalence of obesity is 107.7 million in children and 603.7 million in adults over 70 countries between the year 1980 and 2015 [3].Studies state that abdominal obesity is an emerging health problem, especially Indians are genetically susceptible to fat accumulation around the waist. Obesity as the serious problems of public health, hence there is considerable increase in the risk of chronic diseases, such as cardiovascular diseases, hypertension, CVA, diabetes mellitus, osteoarthritis and certain kinds of cancer. Recently obesity has become a global phenomenon which rapidly increasing and more common in women [4]. And the recent survey conducted on obesity showed about 1.6 billion over weight and 400 million obese people in the world [5]. A review on causes of obesity among university students suggested that physical inactivity, alcohol use, smoking. And dietary behaviour, consumption of red meat, intakes of fiber, high number of meals, skips breakfast more often, snacking behavior [6].
Study stated that balance or posture control is imperative in activities of daily life, as compared to healthy individual balancing is less difficult for obese persons [7]. Y- Balance test is a reliable method to assess the balance of lower extremity which consists of three reach directions Anterior (ANT), Posteromedial (PM), and Posterolateral (PL).There are number of factors that can be assessed using this test such as lower extremity injury risk, maximal reach distance, a calculated composite score and side-to-side asymmetry[8].
SURYANAMASKAR (sun salutation) is a set of 12 asana which is preferably done in the morning while facing the sun. It has numerous health benefits for various systems of the body especially musculoskeletal, cardiovascular, gastrointestinal, nervous system, respiratory and endocrinal.
Studies states that regular practice of suryanamaskar provides improvement in strength, flexibility and improves vitality to the body. It helps in improving the blood circulation thereby mobilizing the excessive amount of fat in the body and thus helpful in reducing the weight [9]. Study done on suryanamaskar suggested that the whole musculoskeletal system is stretched and contracted in a systemic manner, there by provides more strength and flexibility to them, it also stimulates the peristaltic movement of the gut and helps to remove the hidden toxins from the body, microcirculation of the different body organs also increases resulting in oxygenation of the blood and provides good skin health. The practice of suryanamaskar stimulates every large muscle group in the body up to 97% and improves general fitness by strengthening the muscles. The yoga plank or Dandasana comes under the 12 postures of suryanamaskar which is excellent in core muscle control and thereby it improves the balance[10].
The core muscle represents a box with the abdominal muscles in the front, gluteus and paraspinals muscles in the back, the diaphragm at the top, the pelvic floor and hip muscles as the base. The major advantage of this exercise is it can be performed at any time by all the age groups and their abilities. These exercises have been frequently applied by healthy individuals in fitness and sport centers. The core training helps in stabilizing muscles of the abdomen, thorax, and back. Studies states that performing core training on an unstable surface resulted in an increased EMG activity of the core muscles [11]. Sekendiz et. Al, (2010) suggested that core stability exercise with Swiss ball improves strength, flexibility, endurance, and balance in sedentary women. Core stabilization training improves the neuromuscular system efficiency, optimal muscular balance and provides stability [12]. Study done by Seied Sajad Hosseini et al (2012) explained that core stability is a modern training procedure highly concentrate the lumbar and pelvic muscles thereby provides physical fitness parameters, balance, gait, and strength[13].
This study design was particularly aimed to found out the changes in the anthropometrics of obese adults and also to compare the effects in the two groups of exercises and how it helps them in maintaining a healthy life.
AIM OF THE STUDY:
To compare the effect of SURYANAMASKAR versus CORE STABILIZATION using PILATES ball for obese collegiate players.
OBJECTIVES OF THE STUDY:
• To compare the effect of SURYANAMASKAR versus CORE STABILIZATION using PILATES ball for obese adults to improve core strength.
• To compare the effect of SURYANAMASKAR versus CORE STABILIZATION using PILATES ball for obese adults in weight reduction.
• To compare the effect of SURYANAMASKAR versus CORE STABILIZATION using PILATES ball for obese adults to improve balance.
HYPOTHESIS:
NULL HYPOTHESIS:
There was no significant difference in comparing the effects of SURYANAMASKAR and CORE STABILIZATION exercise in weight reduction and improving balance among obese collegiate players.
ALTERNATE HYPOTHESIS:
There was significant difference in comparing the effects of SURYANAMASKAR and CORE STABILIZATION exercise in weight reduction and improving balance among obese collegiate players.
METHODOLOGY:
- STUDY DESIGN: Experimental design
- STUDY TYPE: Comparative study
- STUDY METHOD: Convenient sampling
- STUDY DURATION: 6 weeks
SAMPLE SIZE: 30
- STUDY SETTING: Department of Physiotherapy, JRNRVU
INCLUSION CRITERIA:
-
- AGE: 18-24 of age[2]
- Gender: Both male and female.
- Person with obesity class 1 and class 2
- No history of back pain or leg pain.
EXCLUSION CRITERIA:
-
- Lower extremity injury.
- Recent hip and pelvic fracture.
- Recent upper limb and lower limb fracture
- Person who are not willing to participate.
TOOLS USED:
|
|
Figure 3 Yoga mat
|
|
| Figure 6 Measuring Tape
|
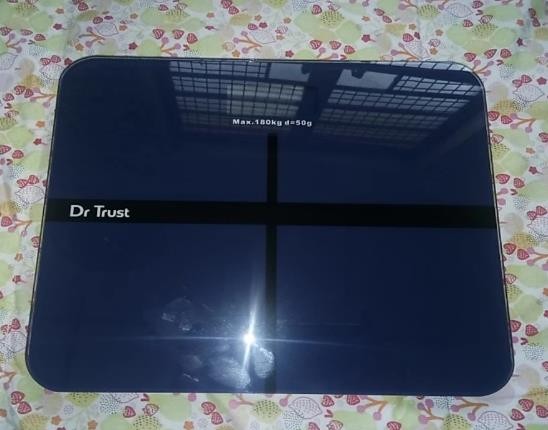 Figure 1- Weight machine
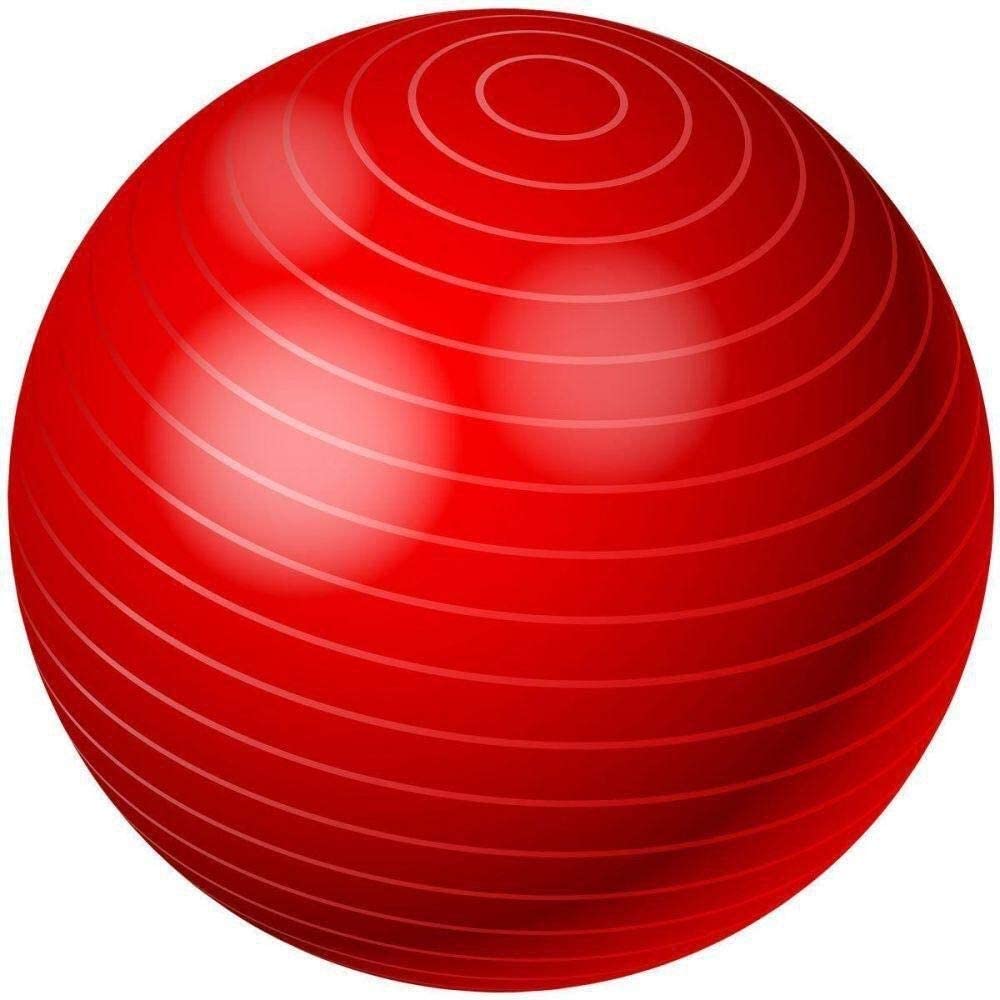 Figure 2 PILATES ball

 Figure 4 Tape
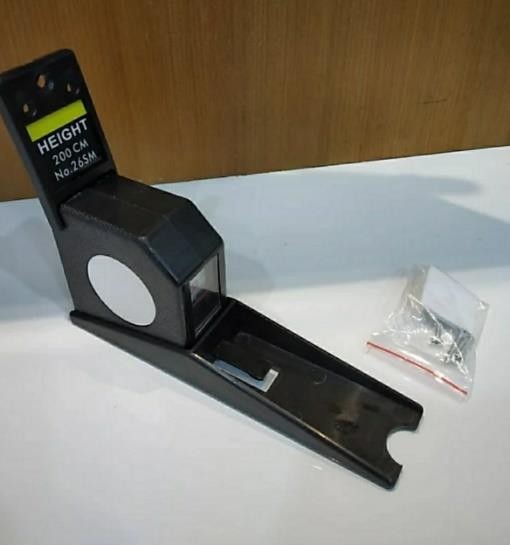 Figure 5 stature
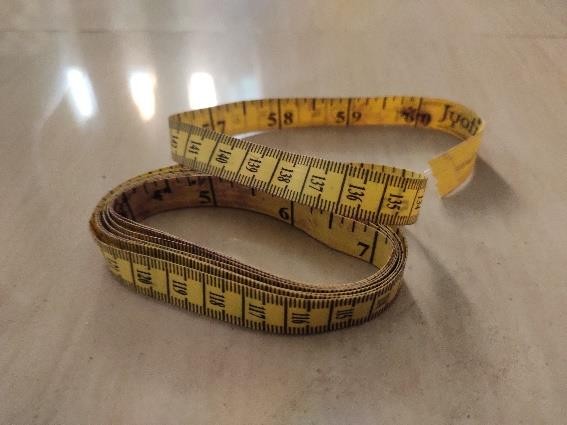
OUTCOME MEASURE:
- BMI
- WAIST CIRCUMFERENCE
- Y BALANCE TEST
PROCEDURE:
In this study, a convenient of 30 obese collegiate players for the study based on inclusion and exclusion criteria. They were selected based on BMI of class 1 and 2. The procedure was adequately explained to the participants before obtaining the informed concern. The concern participants agreed that they would not engage in any other exercise for 6 week period. Then the participants are divided into two groups.
Group A (15 subjects):
Suryanamaskar is given for 5 day a week for 6 weeks in the repetition of 2 sets of 12 cycles for 30 minutes a day is given.
Group B (15 subjects):
Core stabilization exercise is given for 5 day a week for 6 weeks in the repetition of 2 sets of 15 receptions for 30 minutes a day is given.
A session of warm up and cool down is given before and after the exercises for 10 min.
GROUP A:
Suryanamaskar procedure [5, 9]:
Pranamasana (Prayer pose) – 1st & 12th Pose
Stand erect with folded hands close to the chest and palms are held together in the form of prayer pose. Look straight ahead, Exhale the breath normally. (figure8)
Hasta Uttanasana (Raised arms pose) – 2nd & 11th pose
Raise both the hands up above the crown from Pranamasana pose. Inhale the breath normally while raising your hands. Bend the trunk and neck slightly backward. (Figure 9)
Padahastasana (Hand to Foot pose) – 3rd & 10th pose
Bend forward from Hasta Uttanasana pose and try to touch the floor with your both hands. Exhales breathe normally while bending forward. (Figure 10)
Ashwa Sanchalanasana (The Equestrian Pose) – 4th & 9th pose
Stretch the left leg as far back as possible from Padahastasana pose while inhaling the breath normally. At the same time, bend the right knee. While looking straight ahead the hands should be kept straight with fingers touching the floor. Arch the back a little with head tilted back. The same steps should be repeated with left knee in the second round of Surya Namaskar. (Figure 11)
Parvatasana (The Mountain Pose) – 5th & 8th pose
While exhaling, take the right leg backward from Ashwa Sanchalanasana pose and place it parallel to the left leg, raise the buttocks at the same time. Place the hands straight supporting the weight of the body. The head should be placed between the hands. (Figure 12)
Ashtanga Namaskar (Eight-Limbed salutation) – 6th pose;
Lower the body to the ground from Parvatasana pose in such a way that it touches the floor at eight locations – the head, the chest, the two palms, the two knees, and the two toes, Suspended the breath for a while. Try to lift other parts in air. (Figure 13)
Bhujangasana (The Cobra Pose) – 7th pose
While inhaling raise the body by using the hands from Ashtanga Namaskara pose. Arch your head backward. This position looks like the cobra which has raised its hood. (Figure 14)
GROUP B:
CORESTABILIZATION PROCEDURE [11, 17]:
Cross sit-up on PILATES ball:
Putting hands behind the back and making body in angle with the Neck and then with the back pressed against the ball move the hip flexion and extension in crossed manner. (Figure 15, 16)
Back extension on PILATES ball:
Place the hip pressed in the PILATES ball in the prone Lying posture slightly extend the hip with hands behind the back and making body in angle with the neck.(Figure 17).
Quadruped opposite arm – leg rise on PILATES ball:
While maintain a neutral spine kneel on the floor in a quadruped position with your knees under your hips and your hands under your shoulder. Raise the opposite arm and leg straight out maintain whole body in straight line. (Figure 18).
Dynamic Glute Bridge on PILATES ball:
Lay on mat with the arms flat by your sides, both the knees should be bent, and the feet’s should be flat on the top of The PILATES ball. The pressing the feet on PILATES ball raise the hip up. (Figure 19)
Crunch (hip on ball):
Placing hip on PILATES ball nearly touching the floor and with hands behind the Back bring the body up and down. (Figure 20, 21)
DATA ANALYSIS AND INTERPRATION:
Statistical analysis was performed by using IBM SPSS software for windows version 25. The results are calculated using <0.0001(p value) level of significance. Paired t test is used in the analysis of pretest and posttest values of both the groups and the Independent t test is used in the analysis of post session values of the groups.
COMPARISON OF PRE TEST AND POST TEST VALUES OF BMI GROUP A AND GROUP B:
Table 1:
Exercise Group | Mean Value | Standard deviation | t value | P value | ||
Pretest | Post test | Pre test | Post test | |||
Group A | 31.660 | 30.713 | 1.3767 | 1.6392 | 6.250 | ≤0.0001 |
Group B | 30.307 | 29.720 | 0.4183 | 0.4263 | 6.644 | ≤0.0001 |
Graph 1: Graph shows the COMPARISON OF PRE TEST AND POST TEST VALUES OF BMI GROUP A AND GROUP B:
32
31.5
31
30.5
30
Pre test
Post test
29.5
29
28.5
Suryanamaskar
Core stabilization
COMPARISON OF PRE TEST AND POST TEST VALUES OF WAIST CIRCUMFERENCE GROUP A AND GROUP B:
Table 2:
Exercise Group | Mean Value | Standard deviation | t value | P value | ||
Pre test | Post test | Pre test | Post test | |||
Group A (Suryanamaskar) | 98.153 | 96.820 | 6.0526 | 6.1469 | 12.092 | ≤0.0001 |
Group B (Corestabilization) | 94.200 | 93.673 | 6.6151 | 6.5547 | 10.694 | ≤0.0001 |
Graph 2: shows the COMPARISON OF PRE TEST AND POST TEST VALUES OF WAIST CIRCUMFERENCE GROUP A AND GROUP B:
99
98
97
96
95
Pre test
Post test
94
93
92
91
Suryanamaskar
Core stabilization
COMPARISON OF BMI:
Table 3:
Group | Mean | Standard deviation | Standard error |
Group A (Suryanamaskar) | 30.713 | 1.6392 | 0.4232 |
Group B (Corestabilization) | 29.720 | 0.4263 | 0.1101 |
Graph 3: shows the COMPARISON OF BMI:
BMI
30.8
30.6
30.4
30.2
30
29.8
Suryanamaskar
Core stabilization
29.6
29.4
29.2
Suryanamaskar
Core stabilization
COMPARISON OF WAIST CIRCUMFERENCE:
Table 4:
Group | Mean | Standard deviation | Standard error |
Group A (Suryanamaskar) | 99.820 | 6.1469 | 1.5871 |
Group B (Corestabilization) | 93.673 | 6.5547 | 1.6924 |
Graph 4: shows the COMPARISON OF WAIST CIRCUMFERENCE:
Waist circumference
97.5
97
96.5
96
95.5
95
94.5
94
93.5
93
92.5
92
Suryanamaskar
Core stabilization
Suryanamaskar Core stabilization
Y-BALANCE TEST GROUP A (SURYANAMASKAR):
Table 5:
Exercise Group | Mean Value | Standard deviation | t value | P value | ||
Pre test | Post test | Pre test | Post test | |||
Group A (Right side) | 80.927 | 83.427 | 8.746 | 8.491 | -6.079 | <0.000 |
Group A (Left side) | 85.067 | 87.193 | 6.406 | 5.604 | -4.426 | <0.0001 |
Graph 5: Shows the Y-BALANCE TEST GROUP A (SURYANAMASKAR):
Y-BALANCE TEST SURYANAMASKAR
88
87
86
85
84
83
82
81
80
79
78
77
RCS
LCS
PRETEST POST TEST
ALANCE TEST GROUP B (CORESTABILIZATION):
Table 6:
Exercise Group | Mean Value | Standard deviation | t value | P value | ||
Pre test | Post test | Pre test | Post test | |||
Group B (Right side) | 82.433 | 87.287 | 11.9015 | 12.9902 | -7.50 | <0.000 |
Group B (Left side) | 85.427 | 89.927 | 8.4498 | 8.8630 | -4.280 | <0.0001 |
Graph 6: shows the Y-BALANCE TEST GROUP B (CORESTABILIZATION):
Y-BALANCE TEST CORE STABILIZATION
92
90
88
86
84
82
80
78
RCS
LCS
PRETEST POST TEST
COMPARING THE Y-BALNCE TEST OF GROUP A (SURYANAMASKAR) AND GROUP B (CORESTABILIZATION):
Table 7:
Group | Mean | Standard deviation | Standard error |
Group A (Suryanamaskar) | 85.31 | 7.3237 | 1.3371 |
Group B (Corestabilization) | 87.83 | 10.6739 | 1.9488 |
Graph 7: shows the COMPARING THE Y-BALNCE TEST OF GROUP A (SURYANAMASKAR) AND GROUP B (CORESTABILIZATION):
COMPARISON OF Y-BALANCE TEST OF GROUP A AND B
88.5
88
87.5
87
86.5
86
85.5
85
84.5
84
SUYANAMASKAR
CORESTABILIZATION
SUYANAMASKAR
CORESTABILIZATION
RESULT:
-
-
- Table 1: shows a significant value (p≤0.0001) on comparison between the pre (31.660) and post values (30.713) of Group A (SURYANAMASKAR) and pre (30.307) and post value (29.720) of Group B (CORESTABILIZATION) after the 6 weeks of SURYANAMASKAR and CORE STABILIZATION training.
- Graph 1: Shows a significant reduction in BMI in Group A (SURYANAMASKAR) than Group B (CORE STABILIZATION) for obese adult individuals after 6 weeks of training period.
- Table 2: : shows a significant value (p≤0.0001) on comparison between the pre (98.153) and post values (96.820) of Group A (SURYANAMASKAR) and pre (94.2) and post value (93.673) of Group B (CORESTABILIZATION) after the 6 weeks of SURYANAMASKAR and CORE STABILIZATION training
- Graph 2: Shows a significant reduction in WC in Group A (SURYANAMASKAR) than Group B (CORE STABILIZATION) for obese adult individuals after 6 weeks of training period.
- Table 3: shows a significant difference(p≤0.001) on comparison between the pre and post values of Group A (SURYANAMASKAR) (30.713+_0.4232), Group B (CORESTABILIZATION) (29.72+_0.1101) after the 6 weeks SURYANAMASKAR and CORE STABILIZATION training
- Graph 3: Shows a significant reduction in BMI in Group A (SURYANAMASKAR) than Group B (CORE STABILIZATION) for obese adult individuals after 6 weeks of training period.
- Table 4: shows a significant difference (p≤0.001) on comparison between the pre and post values of Group A (SURYANAMASKAR) (99.820+_1.5871), Group B (CORESTABILIZATION) (93.673+_1.6924) after the 6 weeks SURYANAMASKAR and CORE STABILIZATION training.
- Graph 4: Shows a significant reduction in WC in Group A (SURYANAMASKAR) than Group B (CORE STABILIZATION) for obese adult individuals after 6 weeks of training period.
- Table 5: shows a significant value (p≤0.0001) on comparison between the pre (80.927) and post values (83.427) of Group A (SURYANAMASKAR) Right side and pre (85.067) and post value (87.193) of Group A (SURYANAMASKAR) Left side after the 6 weeks of SURYANAMASKAR of Y-balance test.
- Graph 5: Shows a significant improvement in balance after a 6 weeks of SURYANAMASKAR training.
- Table 6: shows a significant value (p≤0.0001) on comparison between the pre (82.433) and post values (87.287) of Group B (CORESTABILIZATION) Right side and pre (85.427) and post value (89.827) of Group B (CORESTABILIZATION) Left side after the 6 weeks of SURYANAMASKAR of Y-balance test.
- Graph 6: Shows a significant improvement in balance after a 6 weeks of CORESTBILIZATION training.
- Table 7: shows a significant difference (p≤0.001) on comparison between the pre and post values of Group A (SURYANAMASKAR) (85.31+_1.3371), Group B (CORESTABILIZATION) (87.83+_1.9488) after the 6 weeks SURYANAMASKAR and CORE STABILIZATION training.
- Graph 7: Shows a significant improvement in Group B (CORESTABILIZATION) than Group A (SURYANAMASKAR) for obese adult individuals after 6 weeks of training period.
- The result shows a significant improvement in the weight reduction in Group A (SURYANAMASKAR) than the Group B (CORESTABILIZATION) and shows a significant improvement in balance in Group A (SURYANAMASKAR)
-
DISCUSSION:
The purpose of the study was to examine the effects of Suryanamaskar and Core stabilization exercise using PILATES ball in reducing the weight and improving balance among obese adults. In this present study, the result showed a significant improvement in the pre- test and post- test of BMI, Waist circumference and Y- Balance test in both the groups. In which the Suryanamaskar group showed significant improvement in weight reduction and core stabilization group showed significant improvement in balance. In total, there was a improvement in the post session results of both the group.
In this study, they investigated the effect of core exercise program using PILATES ball and Swiss ball among young people, they observed that there was an improvement in the fitness, flexibility, dynamic balance, strength and muscular endurance. This result findings supported my result and there was a significant improvement in balance and weight [11].The Suryanamaskar significantly reduces weight in obese women, and decreased the risk factors of obesity, the results of this study findings supported my result and there was a significant reduction in the weight [5]. Due to decrease in physical activity, diet behavior and frequent consumption of high sugary might be related to obesity in young adults. The findings of the previous study supported with the causes of obesity of this present study [2]. Suryanamaskar has significant improvement in the static and dynamic balance of obese individuals as measured using Star excursion balance test. The results of the previous findings supported with my results as there was significant improvement in balance in the Y- balance test scores in the pre-test and post-test. Dr. Sarvesh concluded that practice of Suryanamaskar significantly reduces the obesity parameters such as BMI, waist circumference, abdominal circumference among obese adults. The results of the previous findings supported with my results as there was a significant reduction in the BMI and waist circumference [19].Walter R, et.al, (2012) the study concluded that core training may enable the client or patient to improve the overall stability of the trunk and improve strength. The results of the previous findings supported with my results as there was significant improvement in balance [27]. Dr.M.Ramajayam.et.al (2016) in this study they concluded that there is significant reduction in body fat percentage and basal metabolic rate after doing surya namaskar among obese school boys [22].
The previous study supported with my results as there are significant reduction in the weight parameters of pre and posttest. Gokhan Ipekoglu, et.al, (2018) showed that the PILATES training is effective exercise programme for enhancing dynamic and static balance performance among taekwondo athletes. The results of the previous study supported my result as there is significant improvement in the balance [18].
CONCLUSION:
This study concluded that, both group A and group B shows significant improvement in weight loss ,but the group A(SURYANAMASKAR) shows more significant improvement than group B(CORE STABILIZATION) and both group A and group B shows significant improvement in balance , but group B (CORESTABILIZATION) shows significant improvement than group A (SURYANAMASKAR).
Limitation:
- Duration of the study is small
- The sample size is small
- The age group is limited to 18-24 years
Recommendation:
- In further studies large number of samples can be included
- We can also include other population
- We can extend the study duration for a better result
- Intervention can also be changed in further studies
REFERENCE:
- Norfazilah ahamad, Samia Ibrahim Mohammed Nawi, Mohd Rohaizat Hassan and Hasanain Faisal Ghazi, Abdominal obesity indicators: Waist Circumference or Waist to hip ratio in malaysian adult population.Int J Prev Med.2016; 7:82.2016 Jun 8.
- Ulku S.Karabult,ZashaRomero, Philip Conatser, Murat Karabulut. Assessing Over weight/obesity, Dietary Habits, and physical activity in Hispanic college students. Exercise Medicine 2018, 2:5.
- The GBD 2015 Obesity callabortors. Effects of over weight and obesity in 195 countries over 25years.N Engl J Med. 2017 jun; 377(1):13-27.
- KM Flegal. Waist circumference of healthy men and women in the united states.International Journal of Obesity (2007) 31, 1134-1139.
- Grishmasonawane, Dr.Sanjivini Kamble, Dr.Snehal Ghodeye. Comparative study between Suryanamaskar versus Pilates on Body Mass index in obese women. Volume-9/ Issue / July 2019.
- Karl Peltzer, Supa Pengpid, T.Alafia Samuel,Neslihan Keser ozen, Carolina Mantilla, Onja H.Rahamefy, Mee Lian Wong and Alexander Gasparishvili. Prevalence of overweight/obesity and its associated actors among University students from 22 countries. Int J. Environ. Res. Public Health 2014, 11, 7425-7441.
- Normand Teasdale, Martin.Simonean. Philippe. Corbeil. Grant.Handrigan .Angelo Tremblay.OliverHue. Obesity alters balance and movement control.curr Obes Rep (2013) 2:235-240.
- LTC Scott W.Shaffer,SP USA,LTC Deydre S. Teyhen, SP USA; CPT Chelsea L. Lorenson, SP USA*; CPT Rick L. Warren, SP USA*; CPT Christina M.Koreerat,AP USA*; CPT Crystal A. Straseske, SP USA*;Lt Col John D.Childs, USAF BSC*.Y-Balance test: A reliability involving multiple rateres. MILITARY MEDICINE, Vol.178, November 2013.
- Amit Vaibhav,Swati hula and OmPrakash sing . Surya Namaskar (sun salutation): A path to Good Health.International journal of Pharmacological Research.ISSN:2277-3312, Volume 6 Issue 07(2016).
- Jahnvi Vira, Unnati pandit, Pujanwita Das Majumder. The effect of Suryanamaskar on Static and Dynamic balance in young Overweight and Obese Individuals.International Journal of science and Reaserch(IJSR).Volume 3 Issue 10, October 2014.
- Yildiz Yapark. The effect of core exercise program on motoric skills in young people. Yapark Int J sports exec Med 2018.
- BETUL SKENDIZ, MUTLU CUG, AND FEZA KORKUSUZ.Effect of Swiss ball core strength training on strength, Endurance, Flexibility and Balance in sedentary women.Journal of strength and conditional research.Volume 24/Number11/November 2010.
- Seied Sajad Hosseini, Akram Karimi ASl and Hossein Rostamkhany. The effect of strength and core stabilization training on physical fitness factors among elderly people.World Appilied Sciences Journal 16(4);479-484,2012.ISSN 1818-4952.(2019)
- A.Bulow,CAT,MSc, J.E.Anderson, Phd.J.R.Leiter, Phd, P.B.MacDonald,MD , FRCSC, J. Peeler, CAT (C), Phd,The modified starexcursion Balance and Y-Balance testresults differ when assessing physically activity active healthyadolescent females.The international Jounal of sports Physical Therapy/Volume 14, Number 2/ April 2019/ page 192.
- Dr. V Muruguvalavan and V Jayanthi, Effect of suryanamaskar on body mass index, systolic and diastolic blood pressure among obese working women. International Journal of Yogic, Human Movement and Sports Sciences 2019; 4(1): 976-977
- Gorav Kumar,Guneet Monga,Nilesh Gothi. Measuring impact of Surya Namaskara and Pranayama for management of child obesity in India. International Journal of Contemporary PediatricsKumar G et al. Int J ContempPediatr. 2019 Mar; 6(2):352-357.
- MANA WATANABE,SHIH-LIN HSU, PTS),HARUMI, PTS),SAYA SHIRAHATA,PTS) . Effect of core training on core stability. Phys Ther. Sci. 30: 1014- 1018, 2018.
- Gokhan Ipekoglu, Hakan karabiyik,Fatmanur Er,Ceren Suveren Erdogan,Ergun, Miltat Koz,Gul Baltaci , Does PILATES training affect on dynamic and static balance in adolescence taekwondo athletes. Kinesiology Slovenica, 24, 1, 5-13 (2018), ISSN 1318-2269.
- Dr.Sarvesh Kumar Yadav,Dr. kirti R. Bhati and Dr. lokesh Singh Bhati.Assesment of the effeiciency of suryanamaskar in management of sthaulya.Volume 6, Issue 6, 1035-1044. · June 2017.
- Norfazilah Ahmad, Samia Ibrahim Mohamed Adam, Azmawati Mohammed Nawi,Mohd Rohaizat Hassan, and Hasanain. Abdominal obesity indicators: waist circumference or waist to hip ratio in Malaysian adult population.int J Prev Med. 2016; 7:82.
EFFECTIVENESS OF THERABAND EXERCISES VERSUS PILATES EXERCISES ALONG WITH BASIC ABDOMINAL EXERCISES IN REDUCTION OF ABDOMINAL BELLY
Dr. Divya Tiwari, M.P.T Cardio, Asst. prof. D.P.T. JRNRVU
ABSTRACT
EFFECTIVENESS OF THERABAND EXERCISES VERSUS PILATES EXERCISES ALONG WITH BASIC ABDOMINAL EXERCISES IN REDUCTION OF ABDOMINAL BELLY
Background and Purpose: Abdominal obesity is when excessive abdominal fat around the stomach and abdomen has built up to the extent that may have a negative impact on health. The purpose of this study is to find out the better exercise protocol to reduce abdominal belly and to improve strength and endurance of abdominal muscles.
Materials and Method: Sixty adults (20-40 yrs of age) were evaluated through measuring tape and skin fold caliper. These subjects were conveniently allocated to one of the two groups: Group A (n=30) was administered with the theraband exercises along with the basic abdominal exercises and Group B (n=30) was administered with the pilates exercises along with the basic abdominal exercises.
Results: The Mean (SD) age is 34.40±3.39 (years) for Group A and the Mean (SD) age is 33.00±3.48 (years) for Group B. There was significant differences between Group A and Group B for the reduction of body fat percent, waist circumference, waist-hip ratio and improvement in abdominal muscle endurance (p<0.05) but there was no significant difference between Group A and B for strength improvement of abdominal muscle in the posttest (p>0.05).
Conclusion: There is a significant difference in the reduction of body fat percent, waist-hip ratio, waist circumference and improvement in the abdominal muscle endurance but no significant difference has been seen in muscle strength improvement of abdominal muscle between Group A and Group B.
Keywords: Abdominal Belly, Theraband Exercises and Pilates Exercises
Table of Contents
CHAPTER | TITLE | PAGE NO. |
1 | INTRODUCTION | 1-9 |
Introduction | 1-5 | |
Need of the study | 6 | |
Significance of the study | 6 | |
Aims and Objectives | 6 | |
Hypothesis | 6 | |
Operational definitions | 7-9 | |
2 | REVIEW OF LITERATURE | 10-14 |
3 | MATERIALS AND METHODS | 15-30 |
Study design | 15 | |
Study Setting | 15 | |
Population and Sampling | 15 | |
Selection criteria | 15 | |
Inclusion criteria | 15 | |
Exclusion criteria | 15 | |
Parameters | 16 | |
Instruments and Tools | 16 |
Procedure | 17-28 | |
Statistical tools | 29-30 | |
4 | DATA ANALYSIS AND RESULTS | 31-50 |
5 | DISCUSSION | 51-55 |
Limitations | 55 | |
6 | CONCLUSION AND FUTURE SCOPE OF THE STUDY | 56 |
7 | REFERENCES | 57-62 |
8 | APPENDICES | 63-72 |
Appendice – 1 (Informed Consent) | 63 | |
Appendice – 2 (Assessment Form) | 64-65 | |
Appendice – 3 (Master Chart) | 66-69 | |
Appendice – 4 (Treatment Protocol) | 70-71 | |
Appendice – 5 (Assessment Tools) | 71-72 |
LIST OF TABLES | PAGE NO. | |
TABLE 4.1 | Depicts comparison of mean and SD of age of the subjects of Group A and Group B | 31 |
TABLE 4.2 | Depicts comparison of mean and SD of body fat percent within the Group A and Group B | 32 |
TABLE 4.3 | Depicts comparison of mean and SD of waist circumference within the Group A and Group B | 33 |
TABLE 4.4 | Depicts comparison of mean and SD of waist-hip ratio within the Group A and Group B | 34 |
TABLE 4.5 | Depicts comparison of mean and SD of strength within the Group A and Group B | 35 |
TABLE 4.6 | Depicts comparison of mean and SD of endurance within the Group A and Group B | 36 |
TABLE 4.7 | Depicts comparison of mean and SD of body fat percent for the subjects of Group A and Group B (Pre Readings) | 37 |
TABLE 4.8 | Depicts comparison of mean and SD of body fat percent for the subjects of Group A and Group B (Post Readings) | 38 |
TABLE 4.9 | Depicts comparison of mean and SD of waist circumference for the subjects of Group A and Group B (Pre Readings) | 39 |
TABLE 4.10 | Depicts comparison of mean and SD of waist circumference for the subjects of Group A and Group B (Post Readings) | 40 |
TABLE 4.11 | Depicts comparison of mean and SD of waist-hip ratiofor the subjects of Group A and Group B (Pre Readings) | 41 |
TABLE 4.12 | Depicts comparison of mean and SD of waist-hip ratiofor the subjects of Group A and Group B (Post Readings) | 42 |
TABLE 4.13 | Depicts comparison of mean and SD of strengthfor the subjects of Group A and Group B (Pre Readings) | 43 |
TABLE 4.14 | Depicts comparison of mean and SD of strengthfor the subjects of Group A and Group B (Post Readings) | 44 |
TABLE 4.15 | Depicts comparison of mean and SD of endurancefor the subjects of Group A and Group B (Pre Readings) | 45 |
TABLE 4.16 | Depicts comparison of mean and SD of endurancefor the subjects of Group A and Group B (Post Readings) | 46 |
LIST OF GRAPHS | PAGE NO. | |
GRAPH 4.1 | Demonstrates the comparison of mean value and standard deviation of age between Group A and Group B | 31 |
GRAPH 4.2 | Demonstrates the comparison of mean value and standard deviation of body fat percent within Group A and Group B | 32 |
GRAPH 4.3 | Demonstrates the comparison of mean value and standard deviation of waist circumference within Group A and Group B | 33 |
GRAPH 4.4 | Demonstrates the comparison of mean value and standard deviation of waist-hip ratio within Group A and Group B | 34 |
GRAPH 4.5 | Demonstrates the comparison of mean value and standard deviation of strength within Group A and Group B | 35 |
GRAPH 4.6 | Demonstrates the comparison of mean value and standard deviation of endurance within Group A and Group B | 36 |
GRAPH 4.7 | Demonstrates the comparison of mean value and standard deviation of body fat percent between Group A and Group B for pre readings | 37 |
GRAPH 4.8 | Demonstrates the comparison of mean value and standard deviation of body fat percent between Group A and Group B for post readings | 38 |
GRAPH 4.9 | Demonstrates the comparison of mean value and standard deviation of waist circumference between Group A and Group B for pre readings | 39 |
GRAPH 4.10 | Demonstrates the comparison of mean value and standard deviation of waist circumference between Group A and Group B for post readings | 40 |
GRAPH 4.11 | Demonstrates the comparison of mean value and standard deviation of waist-hip ratio between Group A and Group B for pre readings | 41 |
GRAPH 4.12 | Demonstrates the comparison of mean value and standard deviation of waist-hip ratio between Group A and Group B for post readings | 42 |
GRAPH 4.13 | Demonstrates the comparison of mean value and standard deviation of strength between Group A and Group B for pre readings | 43 |
GRAPH 4.14 | Demonstrates the comparison of mean value and standard deviation of strength between Group A and Group B for post readings | 44 |
GRAPH 4.15 | Demonstrates the comparison of mean value and standard deviation of endurance between Group A and Group B for pre readings | 45 |
GRAPH 4.16 | Demonstrates the comparison of mean value and standard deviation of endurance between Group A and Group B for post readings | 46 |
LIST OF FIGURES | PAGE NO | |
Figure 3.1 | Patient performing squat with theraband | 26 |
Figure 3.2 | Patient performing lunges with theraband | 27 |
Figure 3.3 | Patient performing four point kneeling with opposite arm and leg raise | 28 |
Figure 8.5.1 | Skin caliper and Measuring tape | 72 |
Figure 8.5.2 | Weighing machine | 72 |
INTRODUCTION
There are many important functions of abdominal muscles including coughing, breathing and sneezing. They also play a major role in maintaining the posture and speech in a number of species. There are four muscles which together forms the anterior abdominal wall. They are- Rectus abdominis, Internal and External obliques and Transverse abdominis. The internal oblique and the Transverse abdominis which are the Internal muscles of abdomen respond more to increase in chemical or volume related drive as compared to the Rectus abdominis and External oblique which are the external muscles of abdomen(1).
When unwarranted abdominal fat around the abdomen has built up to the level that it may cause a negative impact on the heath of a person is known as Abdominal obesity. The synonyms of abdominal obesity are beer belly, pot belly or central obesity(2).
Usually obesity is reported in body mass index (BMI) whereas abdominal obesity in waist circumference (WC). According to recent studies which used Indian specific criteria for abdominal obesity, the waist circumference should be more than 35.37 inches (90 cm) in men and 31.44 inches (80cm) in women(3,4).
Women have higher rates for abdominal obesity (women: 56% and men: 35%). Abdominal obesity was found with normal BMI among 5% of men and 14% of women which is known as isolated abdominal obesity(3).
Abdominal obesity does not occur only in elderly and obese people(5). A strong correlation has been found between the central obesity and cardiovascular diseases(6). It is also related to the Alzheimer‟s disease as well as other metabolic and vascular diseases(7). There is also a strong association of abdominal obesity and Type 2 diabetes(8) and high blood pressure, regardless of total body fat(9). There is a term known as Diabesity which refers to the obesity found in Type-2 diabetic patients which is a very common observable fact. Metabolic syndrome includes many conditions like obesity, diabetes and hypertension(10).
The proportion of obese women who are married between 15-49 years of age increased from 11% to 15% according to „National Family Health Survey‟(NFHS) from NFHS-2 to NFHS-3. Under nutrition is more prevailing in rustic areas whereas obesity in metropolitan areas. Lack of physical activity in urban areas may be one of the reason. The rate of under nutrition and obesity, both are higher for women than men(11).
Punjab is found to have the highest percentage of obese women(30%) followed by Kerala(28%) and then Delhi(26%)(12). The increase in generalized obesity is significantly correlated with the hypertension, hypercholesterolemia, metabolic syndrome and diabetes whereas truncal obesity is less strongly correlated with the above risk factors. Thus in Asian Indian people, the increasing cardiovascular risk factors is correlating strongly with the increasing generalized obesity(13).
The prevalence of overweight was higher among the urban areas as compared to urbanizing rural population. But there is a rapid change in the rural population regarding the living conditions which has improved a lot. Improved medical care, transport facilities, educational system and family income along with easy access to city resulted in the changes of lifestyle(14).
A study done in the year 1989 showed that these changes had led to a significant increase in BMI along with abdominal obesity in both males and females. Change in the life style of rural people was said to be a factor for the rising rates of obesity and associated metabolic diseases. The prevalence of obesity increased from 2% – 17.1%(14).
According to the India NFHS, the prevalence of overweight was less than the under nutrition in the country, as obesity was more amongst the urban and high socioeconomic status, generally in women. Because of the less physical activity and amplified intake of energy dense diet, there is an increase in the rate of obesity in urban areas in developing countries(14).
According to a survey which was done to check the obesity differences between males and females in sample of Indian population with 577 adults (270 males and 307 females) between 25-60 years of age in Delhi, India. The correlation was calculated between the systolic and diastolic blood pressure along with other indices of obesity(15).
The result of the survey showed that the rate of hypertension and pre-hypertension was high amongst males and the obesity rate was higher in females. There was a significant correlation between the blood pressure and all the indices of obesity(15).
In a comparison of the two studies conducted by NFHS-2 in 1998-1999 and NFHS-3 in 2005- 2006, there was an increased prevalence of obesity among Indian women specially of the age between 40-49 years (23.7%), who lives in a city (23.5%), have a high qualification (23.8%) and
belonging to Sikh community (31.6%). The problem of under nutrition is still present in India while the additional burden of obesity is really alarming in economically good areas(16).
The incidence of the disorders related to the standard of living changes in India is of concern that occurs either individually or in a combination. Increased tendency to premature coronary artery disease (CAD) and diabetes in Indians has been certified to the Asian Indian Phenotype which is characterized by less generalized obesity which is measured in terms of BMI and abdominal obesity by more waist circumference and waist-hip ratio(17).
In spite of having a lean BMI, an Indian adult has more probability of having central obesity. Indians have appreciably higher body fat percentage than a western with the same blood glucose level and BMI. It can be concluded that less muscle mass and increased body fat may explain the high risk of type-2 diabetes and high prevalence of hyperinsulinemia in Asian Indians(18).
The powerful and perceptive imaging techniques were discovered in the late 1980s and early 1990s that would help to progress our understanding about the health risks related with the buildup of the body fat. Techniques like CT Scan and MRI imaging made it possible to classify mass of adipose tissue located at the abdominal level into intra abdominal fat and subcutaneous fat(19).
Abdominal muscles can be built through the abdominal exercises which is essential for improving the performance with certain sports, back pain and for withstanding abdominal impacts like taking punches. A study was done in 2011 which showed that abdominal exercises increases the strength and endurance of the abdominal muscles(20).
In order to prevent obesity, regular physical activity is very important. It helps in improving the health and decreasing the visceral and abdominal subcutaneous adipose tissue. Specific training programs have resulted in the change in body composition. Endurance training along with resistance training helps in improving the body composition by reducing the fat mass and increasing the total lean mass(21).
A similar study done in the year 2006 showed that the abdominal exercises reduced the size of the subcutaneous abdominal fat cells as Type-2 diabetes is predicted by the size of a cell.
Moderate exercises helped to decrease the cell size by 18% in about 45 obese females over a 20 weeks period whereas diet alone did not found to be as effective to reduce the cell size(20).
A study showed that the indicators of metabolic syndrome can be improved like decrease in the blood sugar level and insulin level and increase in the physical fitness by performing the combined exercises which includes the resistance exercises and aerobic exercises for a middle aged women(22).
Theraband exercises has proved to increase the strength, mobility and function along with the decrease in the joint pain(75). Therabands are colour coded bands which shows the level of resistance and according to it we can plan a treatment program depending upon an individual‟s strength. Change in the colour of the band signifies the progress and improvement in the strength of muscles(23).
There are studies which shows that the visceral adipose tissue(VAT) can be decreased in obesity independent of weight loss through the exercises(24,25). The recent studies showed that the increase in the muscle mass can be attained through resistance training which helps in decreasing the insulin resistance(26), blood lipid profiles are also improved in obese patients with diabetes and cardiovascular diseases(27,28) and it also decreases the visceral fat(29).
Resistance band training improves the strength of a person according to the personal physical condition and provides a proper and individualized load by increasing the band resistance gradually as the muscle strength increases. Along with it, resistance band training is also found to be an effective exercise protocol in order to increase the muscle strength without putting much stress on each muscle or joint(30,31).
Pilates exercises are a form of body mind exercises where the focus is on the controlled movement , posture and breathing(32). They help in improving the flexibility, strength and endurance in human body as a whole(33). Pilates system allows the modification of different exercises by increasing their difficulty level form beginning to advanced. Intensity of the exercises can be increased as the body conditions adapts to the exercises(76).
Pilates builds endurance within individual exercises and also within workouts. These exercises focus on improving one‟s concentration in order to build the strength for both whereas endurance
is improved from mental strength and therefore require determination and persistence. Pilates strengthens the complete body targeting each muscle group with a mixture of dynamic and static strength training evenly. The muscles work from many different directions causing a uniform and very deep strength and tone even without using heavy weights (34).
Need of the study
No study has been done to compare the theraband and pilates exercises in reduction of abdominal belly, so present study was designed to find out the better exercise protocol to reduce abdominal belly and to improve strength and endurance of abdominal muscles.
Significance of the study
This research will help in giving some concrete baseline information about the effectiveness of theraband exercises versus pilates exercises in the reduction of abdominal belly and improving the abdominal muscles strength and endurance.
Aims and Objectives
- To find out the effectiveness of theraband exercises in reduction of abdominal belly and improving abdominal muscles strength and endurance.
- To find out the effectiveness of pilates exercises in reduction of abdominal belly and improving abdominal muscles strength and endurance.
- To compare the effectiveness of theraband exercises and pilates exercises in reduction of abdominal belly and improving abdominal muscles strength and endurance.
Hypothesis
Alternative hypothesis
There is significant difference between theraband exercises and pilates exercises in reducing the abdominal belly and improving the abdominal muscles strength and endurance.
Null hypothesis
There will be no significant difference between theraband exercises and pilates exercises in reducing the abdominal belly and improving the abdominal muscles strength and endurance.
Muscular endurance
It can be defined as the ability of a muscle in order to perform low intensity, repetitive or sustained activities over a prolonged period of time(35).
Theraband
Resistive exercises has proved to increase the strength, mobility and function along with the pain in the joint(75). Therabands come in colour-coded resistance levels so we can plan a program and select the suitable resistance level. Colour change shows our progress, as we work our way through the different levels(23).
Colour | Resistance |
Tan | extra thin Thin Medium Heavy extra heavy special heavy super heavy |
Yellow | |
Red | |
Green | |
Blue | |
Black | |
Silver |
Pilates exercises
They are a set of body mind exercises which focus on a controlled movement, posture and breathing(32). They progress flexibility, develops control and endurance and builds strength(33). Exercises can be modified from beginning to highly developed level of difficulty. As body conditions adapt to the exercises, the intensity of the exercises can be increased(76).
There were original six principles of pilates which includes concentration, control, center, flow, precision, and breathing(36).
Concentration
Intense focus is demanded in Pilates. Concentrate on what is done all the time and on your body for the smooth movements. The technique of exercises done is more important than the exercises themselves(37).
Control
All the exercises should be done with control with the muscles functioning against the gravity to lift(38).
Centering
To control the body during the exercises, starting place is needed: the center. The center a crucial point of the Pilates Method(39).
Flow or efficiency of movement
The aim of Pilates for the adequacy of movement, causing the flow during the use of appropriate transitions. Once accuracy has been achieved, the exercises are intended to flow within and into each other in order to build strength and stamina(40).
Precision
Precision is necessary to correct Pilates: concentrate on the proper movements each time you exercise, if you do them improperly and you lose all the vital benefits of their value (41).
Breathing
Breathing is essential in the Pilates method. Pilates saw the forced exhalation as the key to full inhalation. In Pilates exercises, the practitioner breathes out with the effort and in on the return(42).
Body fat percent
It is measured with the help of skin fold caliper. The skin fold thickness is taken from three sites and then put into the formula to measure body fat percent(43). Formula for calculating body density is-
Men-
Three-Site Formula (chest, abdomen, thigh)
Body Density = 1.10938 – 0.0008267 (sum of three skinfolds) + 0.0000016 (sum of three skin folds)2 – 0.0002574 (age)
Women-
Three-Site Formula (triceps, suprailiac, abdominal)
Body Density = 1.089733 – 0.0009245 (sum of three skin folds) + 0.0000025 (sum of three skin folds)2 – 0.0000979 (age)
Formula for calculating body fat percent-
% Body Fat = 495/BD – 450
MATERIALS and METHODS
Study Design
Comparative study
Study Setting
Family Physiotherapy wellness and rehabilitation centre, Thokar, Udaipur, Rajasthan.
Population and Sampling
Normal sedentary people with varying Body Mass Index (BMI) were taken. A sample of convenience of sixty adults took part in this study. Subjects who fulfilled the inclusion criteria and were ready to attend the exercise program regularly were selected. Subjects were divided into two groups- group A (n=30) and group B (n=30).
Selection Criteria
Inclusion criteria
- Waist circumference should be 35 inches in Males and 31 inches in Females.
- Healthy asymptomatic adults of age 20-40 years (males and females)
- Community dwelling adults and not institutionalized or hospitalized.
- Subjects who are able to ambulate independently without assistive devices.
Exclusion criteria
- Unstable and limiting cardiac disease, history of cardiac surgery
- History of Neurological disease with residual impairments
- Permanent history of dizziness.
- Subjects who had uncorrected hearing or visual impairment.
- Subjects who were receiving physical therapy or any exercise programme at the same time.
- Irregular to attend the exercise programme.
Parameters
- Body fat percent
- Waist Circumference
- Waist-Hip ratio
- Strength of abdominal muscles
- Endurance of abdominal muscles
Instruments and Tools
- Standardized measuring tape
- Skin fold caliper – It is usually the least expensive and is generally available. The specific areas of skin are pinched( and fat) all through the body and then converted to body fat percentage.
The reliability coefficients ranged from 0.62 to 0.85 for the individual sites and from 0.79 to 0.91 for the sums of the three measurements and for the estimates of the percentage of body fat(68).
- Weighing machine
- Therabands
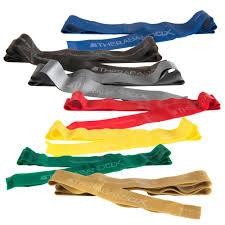
Procedure
The study was designed in which 60 subjects with significant abdominal belly were included in the study after taking a consent form from them. Subjects were assessed for the inclusion and exclusion criteria and were divided into 2 groups – group A and group B by convenient sampling.
Group A received theraband exercises along with basic abdominal exercises and Group B received pilates exercises along with basic abdominal exercises.
The pretest readings of body fat percent, waist circumference, waist-hip ratio, abdominal strength and endurance were recorded before giving the intervention. Then the intervention was given for eight weeks; 3 days a week. After the intervention posttest readings of body fat percent, waist circumference, waist-hip ratio, abdominal strength and endurance were recorded and compared.
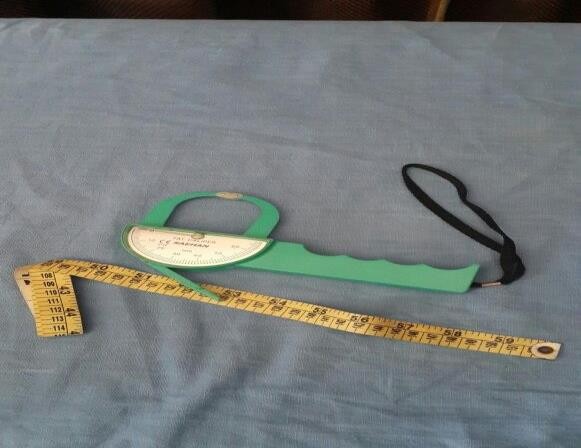
 Figure 8.5.1- showing the skin caliper and measuring tape
Figure 8.5.2– Weighing machine
TOTAL SUBJECTS
68
1 subject was excluded as he did not met the inclusion criteria
GROUP A 33
GROUP B 34
Intervention is of 8 weeks, 3 sessions per week
4 Subjects left because of inability to attend the protocol
3 Subjects left because of
inability
program
to
attend the
Body
Waist
fat
percent,
circumference,
Waist-Hip ratio,
Strength and Endurance
Total Number of Subjects Group A–30
PRE TEST
Body fat percent, Waist circumference, Waist-Hip ratio, Strength and Endurance
Total Number of Subjects Group B –30
PRE TEST
Abdominal Exercises along with Basic Abdominal Exercises
Pilates Exercises along with Basic Abdominal Exercises
Group A – 30
POST TEST
Group B – 30 POST TEST
Group A : Theraband exercises
Serial no. | Theraband exercises | Repetitions |
1 | Lunge | 10 |
2 | Squat | 10 |
3 | Lower Abdominal Crunch | 10 |
4 | Trunk Curl- up | 10 |
5 | Side Bend | 10 |
Lunge
- Lie the band on the floor and stand in the middle of the band with one foot. The ends of the band is grasped around the hands at the chest level with the elbows slightly bent.
- The other leg should be placed behind with knee slightly bent.
- Bent the front knee while keeping the trunk straight and then lower the body downward.
- Return to the upright position slowly and then repeat it again.
Squat
- Stand upright on both legs.
- The band is placed under the feet.
- The ends of the band is held in both the hands with elbow straight.
- Knees to be bent upto 90º.
- In order to put more tension, pull the band.
- Then the knees are straightened.
- Repeat it slowly.
Lower Abdominal Crunch
- Lie on your back keeping both the knees and hips flexed. Take the band stretching it over the knees and then cross it beneath.
- The ends of the band are held in both the hands keeping the elbow straight and arms at the sides.
- Hips are lifted upward off the floor along with the knees.
- Hold the position and then return to the starting position slowly.
Trunk Curl-up
- The ends of the band are firmly fixed to a still entity near the floor.
- With the knees bent, lie on the floor and holding the ends of the band in both the hands with the elbow straight and arms in front.
- Lift the shoulder blades off the floor, curling the trunk upward while keeping both the hands together.
- Hold the position and then return slowly to the starting position.
Side Bend
- If we are bending towards the left side, then stand upright with one end of the band under the right foot and the other end grasped around hand of the same side.
- While keeping the elbow straight bent towards the left side.
- Then return to the starting position and repeat again.
Group B : Pilates exercises
Serial no. | Pilates exercises | Repetitions |
1 | Double Leg Stretch | 10 |
2 | Mat Roll up | 5 |
3 | Four Point Kneeling Opposite Arm & Leg Raise | 10 |
4 | Upper Body Extension (Dart) | 10 |
5 | Criss Cross | 10 |
Double Leg Stretch
-
- Lie on your back keeping the legs straight. Arms should be rested along the sides and the shoulders should touch the ground.
- Draw abs and inhale deeply. Bend the head forward till the chin rests on the chest and at the same time lift both the legs for about 2-6 inches from the floor. Take both the arms above the head in line with the ears.
- During exhalation, bring both the knees towards the chest grasping around with both the hands.
- Then again go for inhalation and return to the extended position.
Mat – Roll Up
-
- Keeping both the arms in extended position above the head, lie down on your back.
- Then inhale deeply and lift the arms above the floor and then exhale and sway into a C curve.
- Inhale while returning back to the extended position.
Four Point Kneeling Opposite Arm & Leg Raise
-
- The starting position is a four point kneeling position. Draw the abdominals and inhale.
- Extend one leg behind and exhale simultaneously. Keep the trunk straight. Extend the leg as much possible, then gently bring the leg to the starting position and inhale.
- After the 5 leg lifts on each side, lift the arm at the same time. If the left leg is lifted then simultaneously lift the right arm.
- Maintain the position along with the drawing of the abdominals.
Upper Body Extension (Dart)
-
- Lie on front with forehead touching the mat.
- Arms are relaxed at the sides.
- Lift the navel from the mat along with the hands and reach to the wall behind.
- While lifting the chest inhale.
Criss Cross
-
- Lie on the floor with both the knees extended and arms resting at the sides. Shoulders are relaxed completely.
- Inhale while drawing the abdominals and bent both the knees in such a position that both the knees make an angle of 90º.
- Consign the hands behind your head, elbows should be straight. Lift the head forward such that the shoulder blades lift off the floor.
- Deeply exhale and then extend the left leg keeping it raised off the mat. Rotate the trunk towards right in such a way that the left armpit reaches towards the right knee.
- Inhale while coming back to the starting position.
- Repeat it with the opposite leg.
Group A and B: Basic Abdominal exercises
Serial no. | Abdominal exercises | Repetitions | Hold time |
1 | Pelvic Tilting | 10 | 5 sec. |
2 | Partial Abdominal Curls | 10 | 3 sec. |
3 | Diagonal Abdominal Curls | 10 | 3 sec. |
4 | Lower Abdominal Exercise | 10 | 5 sec. |
We will increase the number of sets to 3 as the lower abdominal muscles become stronger.
Pelvic Tilting
-
- Lie on back with both the knees bent and feet flat on the floor.
- Lightly draw the abdominal muscles in order to press the arch of the back into the floor.
- This position is held for 5 seconds.
- Repeat it for 10 times.
Partial Abdominal Curls
-
- Lie straight with the back on the floor, both the knees bent and feet flat on the floor.
- Grasp both the hands behind the neck with both the elbows straight.
- Gradually lift the shoulder blades off the floor and tighten the abdominal muscles. The neck should not bend.
- The position is held for 3 seconds.
- Then slowly return to the starting position.Slowly
- Repeat this for 10 times.
Diagonal Abdominal Curls
-
- Lift the shoulder blades off the floor keeping the abdominal muscles tight and then rotate the trunk towards left side.
- Hold this position for 3 seconds.
- Return to the starting position slowly.
- Repeat this with the rotation towards the opposite side.
- Repeat this for 10 times on each side.
Lower Abdominal Exercise
-
- Lie on back with both the knees bent and feet flat on the floor.
- The feet are lifted off the floor in such a way that the knees face the ceiling.
- Lower the right foot slowly that it hardly touches the floor.
- Again bring the right foot back up.
- Repeat this with the other foot for 10 times with each foot.
Figure 3.1- Patient performing squat with the theraband
Figure3.2- Patient performing lunges with the theraband
Figure3.3- Patient performing four point kneeling with opposite arm and leg raise
Statistical Tool
Statistics were performed using SPSS 19 software. To analyze the difference between the reduction of the abdominal belly in Group A and Group B, a student‟s t-test was used. Intra- group analysis between the pre intervention and post intervention scores was also done for both the groups. A significance level of p < 0.05 was fixed.
Mean: Using statistical formula for the mean, for a given number of subjects, mean of different age groups and parameters were calculated by:
X¯ =ΣX/n
Where, n= number of subjects X=each subjects value
Standard deviation (σ):
s= √∑x2/N
x = deviation of score from mean N= number of subjects
Paired t-test: For within group comparison Formula :
t=( X¯ D-μ0)/(sD/ )
XD= average
sD= standard deviation μ0=constant
Unpaired t-test : for between group analysis Formula :
t= X¯ 1– X¯ 2/SX1X2 . √1/𝑛1+1/n2
SX1X2=standard deviation
n1 = number of participants in group 1 n2 = number of participants in group 2
DATA ANALYSIS AND RESULTS
Table 4.1: Mean and SD of age for the subjects of Group A and Group B
Variable | Group | Mean | S.D. | t- value | P value | Result |
Age | Group A | 34.40 | 3.390 | 1.580 | 0.1201 | Not- Significant |
Group B | 33.00 | 3.484 |
Comparison of mean and standard deviation of subject‟s age between the Group A (Theraband exercises Group) and Group B (Pilates exercises Group). The mean age of group A was 34.40±3.39 and that of group B was 33.00±3.48 respectively. The unpaired t test value was 1.580 (p>0.05). There was no significant difference in the age group.
Comparison of Age within the Group
Mean SD
40.00
35.00
30.00
25.00
20.00
15.00
10.00
5.00
0.00
34.40
33.00
3.390
3.484
Group A Group B
Age
Demographic Variables Comparison
Graph 4.1: Demonstrates the comparison of mean value and standard deviation of age between Group A and Group B.
Table 4.2: Mean and SD of body fat percent within the Group A and Group B
Body fat percent | Mean±SD | t- Value | P Value | Result | |
Group A | Pre Test | 34.37±1.732 | 22.100 | 0.0000 | Significant |
Post Test | 29.03±2.220 | ||||
Group B | Pre Test | 34.10±2.074 | 23.010 | 0.0000 | Significant |
Post Test | 30.67±2.040 | ||||
Paired T Test was done to check the changes within the groups (Group A and Group B). For Group A mean and S.D value of body fat percent for Pre Test was 34.37±1.732 and for Post Test was 29.03±2.220. For Group B, mean and S.D values of body fat percent for Pre Test was 34.10±2.074 and for Post Test was 30.67±2.040. The results for the variables were significant which showed that there was significant changes within the Group A and Group B.
Comparison of Body Fat Percent within the Group
Mean S.D.
40.00
34.37 34.10
35.00
30.67
30.00
29.03
25.00
20.00
15.00
10.00
5.00
1.732
2.220
2.074
2.040
0.00
Pre
Post
Pre
Post
Group A
Group B
Body Fat Percent(in %)
Graph 4.2: Demonstrates the comparison of mean value and standard deviation of body fat percent within the Group A and Group B.
Table 4.3: Mean and SD of waist circumference within the Group A and Group B
Waist circumference | Mean±SD | t- Value | P Value | Result | |
Group A | Pre Test | 35.79±1.674 | 9.940 | 0.0000 | Significant |
Post Test | 33.15±2.319 | ||||
Group B | Pre Test | 35.79±1.973 | 8.750 | 0.0000 | Significant |
Post Test | 34.48±1.953 | ||||
Paired T Test was done to check the changes within the groups (Group A and Group B). For Group A mean and S.D values of waist circumference for Pre Test was 35.79±1.674 and for Post Test was 33.15±2.319. For Group B, mean and S.D values of waist circumference for Pre Test was 35.79±1.973 and for Post Test was 34.48±1.953. The results for the variables were significant which showed that there was significant changes within the Group A and Group B.
Comparison of Waist Circumference within the Group
MEAN SD
40.00
35.79
35.00
35.79
33.15
34.48
30.00
25.00
20.00
15.00
10.00
5.00
1.674
2.319
1.973
1.953
0.00
Pre
Post
Pre
Post
Group A
Group B
Waist Circumference(in inches)
Graph 4.3: Demonstrates the comparison of mean value and standard deviation of waist circumference within the Group A and Group B.
Table 4.4: Mean and SD of waist-hip ratio within the Group A and Group B
Waist-Hip ratio | Mean±SD | t- Value | P Value | Result | |
Group A | Pre Test | 1.51±0.237 | 12.050 | 0.0000 | Significant |
Post Test | 1.00±0.080 | ||||
Group B | Pre Test | 1.56±0.219 | 6.670 | 0.0000 | Significant |
Post Test | 1.29±0.205 | ||||
Paired T Test was done to check the changes within the groups (Group A and Group B). For Group A mean and S.D values of waist-hip ratio for Pre Test was 1.51±0.237 and for Post Test was 1.00±0.080. For Group B, mean and S.D values of waist-hip ratio for Pre Test was 1.56±0.219 and for Post Test was 1.29±0.205. The results for the variables were significant which showed that there was significant changes within the Group A and Group B.
Comparison of Waist-Hip Ratio within the Group
MEAN sd
1.80
1.60
1.51
1.56
1.40
1.29
1.20
1.00
1.00
0.80
0.60
0.40
0.237
0.219
0.205
0.20
0.080
0.00
Pre
Post
Pre
Post
Group A
Group B
Waist-Hip ratio
Graph 4.4: Demonstrates the comparison of mean value and standard deviation of waist- hip ratio within the Group A and Group B.
Table 4.5: Mean and SD of strength within the Group A and Group B
Strength | Mean±SD | t- Value | P Value | Result | |
Group A | Pre Test | 3.60±0.93 | 8.120 | 0.0000 | Significant |
Post Test | 4.90±0.66 | ||||
Group B | Pre Test | 3.73±0.98 | 9.950 | 0.0000 | Significant |
Post Test | 4.97±0.81 | ||||
Paired T Test was done to check the changes within the groups (Group A and Group B). For Group A mean and S.D values of strength for Pre Test was 3.60±0.93 and for Post Test was 4.90±0.66. For Group B, mean and S.D values of strength for Pre Test was 3.73±0.98 and for Post Test was 4.97±0.81. The results for the variables were significant which showed that there was significant changes within the Group A and Group B.
Comparison of Strength within the Group
mean SD
6.00
4.97
5.00
4.90
4.00
3.60
3.73
3.00
2.00
0.93
0.98
1.00
0.66
0.81
0.00
Pre
Post
Pre
Post
Group A
Group B
Strength(grade)
Graph 4.5: Demonstrates the comparison of mean value and standard deviation of strength within the Group A and Group B.
Table 4.6: Mean and SD of endurance within the Group A and Group B
Endurance | Mean±SD | t- Value | P Value | Result | |
Group A | Pre Test | 5.57±0.858 | 13.760 | 0.0000 | Significant |
Post Test | 7.87±1.074 | ||||
Group B | Pre Test | 5.20±1.031 | 9.250 | 0.0000 | Significant |
Post Test | 7.10±1.213 | ||||
Paired T Test was done to check the changes within the groups (Group A and Group B). For Group A mean and S.D values of endurance for Pre Test was 5.57±0.858 and for Post Test was 7.87±1.074. For Group B, mean and S.D values of endurance for Pre Test was 5.20±1.031 and for Post Test was 7.10±1.213. The results for the variables were significant which showed that there was significant changes within the Group A and Group B.
Comparison of Endurance within the Group
Mean SD
9.00
8.00
7.00
6.00
5.00
7.10
5.57
5.20
4.00
3.00
2.00
1.00
0.858
1.074
1.031
1.213
0.00
Pre
Post
Pre
Post
Group A
Group B
Endurance(per min)
7.87
Graph 4.6: Demonstrates the comparison of mean value and standard deviation of endurance within the Group A and Group B.
Table 4.7: Mean and SD of body fat percent for the subjects of Group A and Group B (Pre Readings)
Pre test | Group | Mean | S.D. | t- value | P value | Result |
Body Fat Percent (in %) | Group A | 34.37 | 1.732 | 0.540 | 0.5908 | Not- Significant |
Group B | 34.10 | 2.074 |
Comparison of mean and standard deviation of body fat percent between the pre readings of Group A and Group B. The mean of body fat percent of group A was 34.37±1.73 and of group B was 34.10±2.07 respectively. The unpaired t- test value was 0.540 (p>0.05). There was no significant difference in the body fat percent between the groups.
Comparison of Body Fat Percent between the Groups (Pre Readings)
40.00
35.00
30.00
25.00
20.00
34.37
15.00
10.00
5.00
0.00
1.732
2.074
Group A Group B
Body Fat Percent(in %)
34.10
Mean SD
Graph 4.7: Demonstrates the comparison of mean value and standard deviation of body fat percent between Group A and Group B.
Table 4.8: Mean and SD of body fat percent for the subjects of Group A and Group B (Post Readings)
Post test | Group | Mean | S.D. | t- value | P value | Result |
Body Fat Percent (in %) | Group A | 29.03 | 2.220 | 2.970 | 0.0044 | Significant |
Group B | 30.67 | 2.040 |
Comparison of mean and standard deviation of body fat percent between the post readings of Group A and Group B. The mean of body fat percent of group A was 29.03±2.22 and of group B was 30.67±2.04 respectively. The unpaired t- test value was 2.970 (p<0.05). There was significant difference in the reduction of body fat percent between the groups.
Comparison of Body Fat Percent between the Group (Post Readings)
MEAN SD
35.00
30.67
30.00
29.03
25.00
20.00
15.00
10.00
5.00
2.220
2.040
0.00
Group A
Group B
Body Fat Percent(in %)
Graph 4.8: Demonstrates the comparison of mean value and standard deviation of body fat percent between Group A and Group B.
Table 4.9: Mean and SD of body fat percent for the subjects of Group A and Group B (Pre Readings)
Pre test | Group | Mean | S.D. | t- value | P value | Result |
Waist Circumference (in inches) | Group A | 35.79 | 1.674 | 0.010 | 0.9944 | Not-Significant |
Group B | 35.79 | 1.973 |
Comparison of mean and standard deviation of waist circumference between the pre readings of Group A and Group B. The mean of waist circumference of group A was 35.79±1.67 and of group B was 35.79±1.97 respectively. The unpaired t- test value was 0.010(p>0.05). There was no significant difference in the waist circumference between the groups.
Comparison of Waist Circumference between the Group (Pre Readings)
40.00
35.79
35.79
35.00
30.00
25.00
20.00
15.00
10.00
5.00
0.00
Group A
Group B
Waist Circumference(in inches)
Mean SD
1.973
1.674
Graph 4.9: Demonstrates the comparison of mean value and standard deviation of waist circumference between Group A and Group B.
Table 4.10: Mean and SD of waist circumference for the subjects of Group A and Group B (Post Readings)
Post test | Group | Mean | S.D. | t- value | P value | Result |
Waist Circumference (in inches) | Group A | 33.15 | 2.319 | 2.400 | 0.0195 | Significant |
Group B | 34.48 | 1.953 |
Comparison of mean and standard deviation of waist circumference between the post readings of Group A and Group B. The mean of waist circumference of group A was 33.15±2.32 and of group B was 34.48±1.95 respectively. The unpaired t- test value was 2.400(p<0.05). There was significant difference in the reduction of waist circumference between the groups.
Comparison of Wiast Circumference between the Group (Post Readings)
40.00
35.00
Mean SD
33.15
34.48
30.00
25.00
20.00
15.00
10.00
5.00
2.319
1.953
0.00
Group A
Group B
Waist Circumference(in inches)
Graph 4.10: Demonstrates the comparison of mean value and standard deviation of waist circumference between Group A and Group B.
Table 4.11: Mean and SD of waist-hip ratio for the subjects of Group A and Group B (Pre Readings)
Pre test | Group | Mean | S.D. | t- value | P value | Result |
Waist-Hip ratio | Group A | 1.51 | 0.237 | 0.900 | 0.3727 | Not- Significant |
Group B | 1.56 | 0.219 |
Comparison of mean and standard deviation of waist-hip ratio between the pre readings of Group A and Group B. The mean of waist-hip ratio of group A was 1.51±0.24 and of group B was 1.56±0.21respectively. The unpaired t- test value was 0.900(p>0.05). There was no significant difference in the waist-hip ratio between the groups.
Comparison of Wais-Hip Ratio between the Group (Pre Readings)
1.80
1.60
1.40
1.20
1.00
0.80
0.60
0.40
0.20
0.00
1.51
1.56
Group A Group B
Waist-Hip ratio
Mean SD
0.219
0.237
Graph 4.11: Demonstrates the comparison of mean value and standard deviation of waist- hip ratio between Group A and Group B.
Table 4.12: Mean and SD of waist-hip ratio for the subjects of Group A and Group B (Post Readings)
Post test | Group | Mean | S.D. | t- value | P value | Result |
Waist- Hip ratio | Group A | 1.00 | 0.080 | 7.340 | 0.0000 | Significant |
Group B | 1.29 | 0.205 |
Comparison of mean and standard deviation of waist-hip ratio between the post readings of Group A and Group B. The mean of waist-hip ratio of group A was 1.00±0.08 and of group B was 1.29±0.21 respectively. The unpaired t- test value was 7.340(p<0.05). There was significant difference in the reduction of waist-hip ratio between the groups.
Comparison of Waist-Hip Ratio between the Group (Post Readings)
1.40
1.29
Mean SD
1.20
1.00
1.00
0.80
0.60
0.40
0.205
0.20
0.080
0.00
Group A
Group B
Waist-Hip ratio
Graph 4.12: Demonstrates the comparison of mean value and standard deviation of waist- hip ratio between Group A and Group B.
Table 4.13: Mean and SD of strength for the subjects of Group A and Group B (Pre Readings)
Pre test | Group | Mean | S.D. | t- value | P value | Result |
Strength (grade) | Group A | 3.60 | 0.932 | 0.540 | 0.5914 | Not-Significant |
Group B | 3.73 | 0.980 |
Comparison of mean and standard deviation of strength between the pre readings of Group A and Group B. The mean of strength of group A was 3.60±0.93 and of group B was 3.73±0.98 respectively. The unpaired t- test value was 0.540(p>0.05). There was no significant difference in the strength between the groups.
Comparison of Strength between the Group (Pre Readings)
4.00
3.50
3.00
2.50
2.00
1.50
1.00
0.50
0.00
3.60
3.73
Mean SD
0.980
Group A Group B
Strength(grade)
0.932
Graph 4.13: Demonstrates the comparison of mean value and standard deviation of strength between Group A and Group B.
Table 4.14: Mean and SD of strength for the subjects of Group A and Group B (Post Readings)
Post test | Group | Mean | S.D. | t- value | P value | Result |
Strength (grade) | Group A | 4.90 | 0.662 | 0.350 | 0.7280 | Not-Significant |
Group B | 4.97 | 0.809 |
Comparison of mean and standard deviation of strength between the post readings of Group A and Group B. The mean of strength of group A was 4.90±0.66 and of group B was 4.97±0.80 respectively. The unpaired t- test value was 0.350(p>0.05). There was no significant difference in the improvement of the strength between the groups.
Comparison of Strength between the Group (Post Readings)
6.00
MEAN SD
5.00
4.90
4.97
4.00
3.00
2.00
1.00
0.662
0.809
0.00
Group A
Group B
Strength(grade)
Graph 4.14: Demonstrates the comparison of mean value and standard deviation of strength between Group A and Group B.
Table 4.15: Mean and SD of endurance for the subjects of Group A and Group B (Pre Readings)
Pre test | Group | Mean | S.D. | t- value | P value | Result |
Endurance (per min) | Group A | 5.57 | 0.858 | 1.500 | 0.1397 | Not-Significant |
Group B | 5.20 | 1.031 |
Comparison of mean and standard deviation of endurance between the pre readings of Group A and Group B. The mean of endurance of group A was 5.57±0.86 and of group B was 5.20±1.03 respectively. The unpaired t- test value was 1.500(p>0.05). There was no significant difference in the improvement of the endurance between the groups.
Comparison of Endurance between the Group (Pre Readings)
6.00
5.20
Mean SD
5.00
4.00
3.00
2.00
1.00
0.00
Group A
Group B
Endurance(per min)
5.57
0.858
1.031
Graph 4.15: Demonstrates the comparison of mean value and standard deviation of endurance between Group A and Group B.
Table 4.16: Mean and SD of endurance for the subjects of Group A and Group B (Post Readings)
Post test | Group | Mean | S.D. | t- value | P value | Result |
Endurance (per min) | Group A | 7.87 | 1.074 | 2.590 | 0.0121 | Significant |
Group B | 7.10 | 1.213 |
Comparison of mean and standard deviation of endurance between the post readings of Group A and Group B. The mean of endurance of group A was 7.87±1.07 and of group B was 7.10±1.21 respectively. The unpaired t- test value was 2.59(p<0.05). There was significant difference in the improvement of the endurance between the groups.
Comparison of Endurance between the Group (Post Readings)
9.00
8.00
7.00
6.00
5.00
4.00
3.00
2.00
1.00
0.00
7.87
Mean SD
7.10
1.074
1.213
Group A Group B
Endurance(per min)
Graph 4.16: Demonstrates the comparison of mean value and standard deviation of endurance between Group A and Group B.
RESULTS
Total 68 subjects were taken but one subject was excluded as he did not met the inclusion criteria so, the total number of subjects were 67 with 33 subjects in Group A which received Theraband exercises for abdominal obesity and 34 subjects in Group B which received Pilates exercises for abdominal obesity (3 days per week for total 8 weeks). 3 subjects from Group A and 4 subjects from Group B left the treatment protocol in between because of inability to attend it regularly.
Comparison of mean and standard deviation of subject‟s age(20-40) between the group A(Theraband Exercises) and group B(Pilates Exercises).The mean age of group A was 34.40 ±
3.390 and that of group B was 33.00±3.484 respectively . The unpaired t-test value was 1.580(p>0.05). No significant difference was there in the age group.
The mean and standard deviation of the variable body fat percent within the group A was 34.37 ± 1.732 and 29.03 ± 2.220 respectively. Paired t-test was done within group A for the variable body fat percent to check the changes within the group. The t-value for body fat percent was 22.100(p<0.05).The result for the variable was significant which showed that there were significant changes within the group.
The mean and standard deviation of the variable waist circumference within the group A was
35.79 ± 1.674 and 33.15 ± 2.319 respectively. Paired t-test was done within group A for the variable waist circumference to check the changes within the group. The t-value for waist circumference was 9.940(p<0.05).The result for the variable was significant which showed that there were significant changes within the group.
The mean and standard deviation of the variable waist-hip ratio within the group A was 1.51 ±
0.237 and 1.00 ± 0.080 respectively. Paired t-test was done within group A for the variable waist-hip ratio to check the changes within the group. The t-value for waist-hip ratio was 12.050(p<0.05).The result for the variable was significant which showed that there were significant changes within the group.
The mean and standard deviation of the variable strength within the group A was 3.60 ± 0.93 and
4.90 ± 0.66 respectively. Paired t-test was done within group A for the variable strength to check
the changes within the group. The t-value for strength was 8.120(p<0.05).The result for the variable was significant which showed that there were significant changes within the group.
The mean and standard deviation of the variable endurance within the group A was 5.57 ± 0.858 and 7.87 ± 1.074 respectively. Paired t-test was done within group A for the variable endurance
to check the changes within the group. The t-value for endurance was 13.760(p<0.05).The result for the variable was significant which showed that there were significant changes within the group.
The mean and standard deviation of the variable body fat percent within the group B was 34.310
± 2.074 and 30.67 ± 2.040 respectively. Paired t-test was done within group B for the variable body fat percent to check the changes within the group. The t-value for body fat percent was 23.010(p<0.05).The result for the variable was significant which showed that there were significant changes within the group.
The mean and standard deviation of the variable waist circumference within the group B was
35.79 ± 1.973 and 34.48 ± 1.953 respectively. Paired t-test was done within group B for the variable waist circumference to check the changes within the group. The t-value for waist circumference was 8.750(p<0.05).The result for the variable was significant which showed that there were significant changes within the group.
The mean and standard deviation of the variable waist-hip ratio within the group B was 1.56 ±
0.219 and 1.29 ± 0.205 respectively. Paired t-test was done within group B for the variable waist- hip ratio to check the changes within the group. The t-value for waist-hip ratio was 6.670(p<0.05).The result for the variable was significant which showed that there were significant changes within the group.
The mean and standard deviation of the variable strength within the group B was 3.73 ± 0.98 and
4.97 ± 0.81 respectively. Paired t-test was done within group B for the variable strength to check the changes within the group. The t-value for strength was 9.950(p<0.05).The result for the variable was significant which showed that there were significant changes within the group.
The mean and standard deviation of the variable endurance within the group B was 5.20 ± 1.031 and 7.10 ± 1.213 respectively. Paired t-test was done within group B for the variable endurance
to check the changes within the group. The t-value for endurance was 9.250(p<0.05).The result for the variable was significant which showed that there were significant changes within the group.
Unpaired t-test was done for the pre-readings of body fat percent between the group A and B to check the changes between the groups. The t-value for body fat percent was 0.540(p>0.05). The result for the variable was not significant.
Unpaired t-test was done for the pre-readings of waist circumference between the group A and B to check the changes between the groups. The t-value for waist circumference was 0.010(p>0.05). The result for the variable was not significant.
Unpaired t-test was done for the pre-readings of waist-hip ratio between the group A and B to check the changes between the groups. The t-value for waist-hip ratio was 0.900(p>0.05). The result for the variable was not significant.
Unpaired t-test was done for the pre-readings of strength between the group A and B to check the changes between the groups. The t-value for strength was 0.540(p>0.05). The result for the variable was not significant.
Unpaired t-test was done for the pre-readings of endurance between the group A and B to check the changes between the groups. The t-value for endurance was 1.500(p>0.05). The result for the variable was not significant.
Unpaired t-test was done for the post-readings of body fat percent between the group A and B to check the changes between the groups. The t-value for body fat percent was 2.970(p<0.05). The result for the variable was significant which showed that there were significant changes between the groups.
Unpaired t-test was done for the post-readings of waist circumference between the group A and B to check the changes between the groups. The t-value for waist circumference was 2.400(p<0.05). The result for the variable was significant which showed that there were significant changes between the groups.
Unpaired t-test was done for the post-readings of waist-hip ratio between the group A and B to check the changes between the groups. The t-value for waist-hip ratio was 7.340(p<0.05). The result for the variable was significant which showed that there were significant changes between the groups.
Unpaired t-test was done for the post-readings of strength between the group A and B to check the changes between the groups. The t-value for strength was 0.350(p>0.05). The result for the variable was not significant.
Unpaired t-test was done for the post-readings of endurance between the group A and B to check the changes between the groups. The t-value for endurance was 2.590(p<0.05). The result for the variable was significant which showed that there were significant changes between the groups.
DISCUSSION
The study was designed to evaluate the comparative effect of Theraband exercises and Pilates exercises in abdominal obesity. 60 subjects were taken and divided into 2 groups, 30 patients in each group. Group A received Theraband exercises for abdominal obesity (3 days per week) and Group B received Pilates exercises for abdominal obesity (3 days per week), for total 8 weeks.
The selected parameters were Body Fat Percent, Waist Circumference, Waist-Hip Ratio, Strength and Endurance. Data was collected at baseline (day 0) and after 8 weeks of treatment to evaluate the changes in the mentioned parameters.
The findings of the present study show that there is a significant difference in the reduction of body fat percent, waist circumference, waist-hip ratio and improvement in the strength and endurance of abdominal muscles within the groups. Significant difference was found between the groups on the 8th week of protocol in all the parameters except for the improvement in the strength of abdominal muscles. But there was appreciably more significant difference in the group with the treatment protocol of theraband exercises than the group with pilates exercises.
Abdominal obesity occurs when there is excessive deposition of fat around the abdomen which causes negative impact over the health(2). Abdominal obesity is usually measured in terms of waist circumference(3,4). It has been found that the abdominal obesity is one of the leading cause of cardiovascular diseases along with metabolic diseases(5, 14).
Abdominal muscles are considered as operational stability system for the spine which protect it from several injuries and hence the weakness of these muscles can result into the decreased spinal stability(44). There are abdominal exercises which build up the abdominal muscles in order to improve their performance and along with this they also increase the strength and endurance of the abdominal muscles(20).
Theraband exercises reduces the total fat mass and glycosylated hemoglobin, decreases the abdominal fat and insulin resistance by increasing the muscle mass and also improves the blood lipid profiles in abdominal obesity. When compared with theraband exercises, aerobic exercises reduces visceral fat and decreases insulin resistance but there is no effect on the mass of a abdominal muscles and hence the muscle strength reduces at a greater rate(56).
Dynamic resistance training program with the use of free weights put more stress over the skeletal muscle and can cause injuries. Theraband training control the strength as per the person‟s physical condition and provides proper individualized load by increasing the band resistance gradually as there is increase in the muscle strength(56).
Theraband provides resistance based on the amount that the band is stretched. This resistance can be calculated in pounds of force which depends on the percentage the band is stretched from its resting length which is known as „Force Elongation‟. Therabands provide a strength curve (torque) similar to human strength curve and isotonic resistance exercises (bell shaped curve) which occurs because of the angle created between the band and the lever arm and the angle is known as „Force Angle‟(69).
Theraband does not rely on gravity and provides continuous tension to the muscles which are being trained. It provides linear variable resistance which means as we increase range of motion of the exercise, the resistance offered by the band is also increased. Therefore, there is more increase in the muscle strength as more muscle fibres are used during the training(69).
There are many forms of dance, movement education along with several rehabilitation methods which are influenced by the Pilates method. It has also become a part of the exercise prescription in many of the bodywork fields(70).
Pilates is a fitness program of mind and body that incorporates breathing and movement to achieve balance and body awareness(50). Pilates exercises can be performed in group or private settings with and without apparatus. Pilates exercises focus upon the core musculature eg. Abdominal muscles, back, hips and shoulder girdle. The movements rely upon correct positioning of the body relative to the gravity as well as limb length alterations to develop the core muscles(49).
A few research had mentioned that the physical activity has been commonly used and studied as a health related factor and it is also mentioned that there is significant influence of regular physical activity on health. Moreover, Pilates is popular amongst women and it has also given a new way to physiotherapy(71).
Pilates exercises increases the insulin sensitivity through the reduction of body fat percentage and fat deposition in the waist region which results in decreased leptin levels through regulation of insulin and in turn fat is distributed(72).
Triber FA et al.(1998) conducted a study to determine the effect of a 4 week isotonic resistance training program with the help of theraband on concentric shoulder rotator strength in tennis players and found that internal rotation torque at both slow and fast speeds and also in external rotation torque at fast speed is improved. Hence concluded that resistance training have beneficial effects on strength and functional performance, the result of the present study was supported by the results of Triber FA in increased strength of core muscles by use of therabands(69) . The same findings were also concluded by Varun Naik in a non-published thesis on athletes with low back pain which showed the improvement in core strength with therabands(69).
Baldi and Snowling did a study and found that even though 10 weeks of resistance training decreased the insulin level, insulin resistance was not changed. This concluded that the effectiveness of resistance training on improving insulin resistance vary according to the frequency, intensity and duration of training(56).
Therefore low intensity exercise should be done during the early stages of resistance training daily and then doing them for 3 days a week(56). The results from these studies support our study for the improvement of strength of abdominal muscles.
Another study did a research to find the effect of 12 week pilates exercise program for overweight women and they found that skin fold thickness and BMI was reduced . This result showed that the pilates exercise program had potential to improve performance in many physiological variables for overweight women. Ramezankhany et al. (2010) compared low calorie diet, aerobic and pilates exercises in sedentary women and found the significant changes in waist-hip ratio and weight loss(49).
Ferreira et al. (2009) checked the effect of pilates exercises on body composition for sedentary women and no statistically significant difference was found among the exercise group and control group at baseline. It was thought that the frequency and intensity may be the cause as the subjects participated in pilates program for only 2 hours in each weak(49).
Barbara Strasser et al. studied about the evidence of resistance training in the treatment of obesity and concluded that resistive exercises mobilizes the visceral and subcutaneous adipose tissue in the abdominal region. It is also reported that when resistive exercises are performed with sufficient intensity and regularly, it stimulates the skeletal muscle to synthesize new muscle proteins(55). This study is in the support of our study which showed that theraband exercises are beneficial in the reduction of body fat percent, waist circumference and waist-hip ratio in abdominal obesity.
A recent study did examination about the effects of systematic resistance training in aged people and found that the training having 2 sessions per week was as proficient as the training involving 3 sessions per week but the number of sets should be equally done(55).
However, these findings contradict the results of earlier study which had concluded that 3 sessions of training per week has more strength gain when compared to the resistance training given for 2 sessions a week(55) and it also supports our present study as the treatment protocol for the reduction of abdominal obesity taken in the study was 3 sessions per week for 8 weeks.
The previous studies showed that the resistance training helps to reduce the glycosylated hemoglobin levels in people with abnormal glucose metabolism and consequently improves the lipoprotein lipid profiles. In people with metabolic risks, decreased fat mass, improved blood lipid profiles and glycemic control are essential to decrease micro and macro vascular complications(55).
Based on the findings of all these studies, the resistance training is well thought-out to be a potential addition in the treatment of metabolic disorders by decreasing the risk factors for metabolic syndromes. The study also concluded that the resistance training can be used or suggested in managing the obesity and metabolic disorders (52). The results from these studies further support our present study that theraband exercises are more effective and beneficial in reducing the body fat percent, waist circumference, waist-hip ratio and improving the endurance and strength of abdominal muscles.
Muscle endurance can be defined as the ability of a muscle to produce and maintain force production for prolonged periods of time. Research has shown that resistance training protocols improves the muscular endurance with high repetition. Campos et al. found that higher
repetitions (2 sets of 20-28 repetitions with 1 minute rest period starting with 2 days/week) increased muscle endurance. Marx et al. found that after the initial 12 weeks of training results in a threefold decrease in body fat and an increase in muscle endurance with significant increase in lean body mass (73). This supports the present study as muscle endurance is significantly improved with the theraband exercises protocol.
Resistance training affects the amount of fat mass as a result of the direct effect of the training on energy consumption. Lower volume training burns less calories as compared to the higher volume training. Also the resistance training increases the energy consumption during the recovery period between training sessions further causing the fat loss (74).
In the study, the theraband exercises come out with more effectiveness than the Pilates exercises because the resistance provided by the theraband is based on the amount of stretching of band. The beginning of the exercise is done with the color band providing the appropriate resistance according to the strength of a person and is increased gradually as the strength increases of abdominal muscles whereas Pilates exercises are based on certain principles which had to be followed effectively while performing exercises like breathing, concentration etc. in order to gain more efficiency.
LIMITATIONS
- Convenient sampling was used.
- Absence of control group.
- Subjects were not asked for any sort of diet control.
- Follow up was not taken to check retention effect of the treatment.
Recoomendation
- Gender specific studies can be done to see the effect of intervention protocol.
- Studies to check the effect of diet control along with exercises on reduction of abdominal obesity can be done as a future scope.
- A long term follow-up of the study is recommended for a more comprehensive analysis of recovery.
- The strength of abdominal muscles can also be investigated through electromyographyic finding
CONCLUSION
The present study concluded that there is a significant difference in the reduction of body fat percent, waist circumference, waist-hip ratio and improvement in the endurance of the abdominal muscles but no significant difference has been seen in the improvement of abdominal muscle strength between the Group A and Group
REFERENCES
- Iscoe S. Control of abdominal muscles, Progress in Neurobiology, 1998, Vol. 56 (4), page no. 433–506.
- Yusuf S, Hawken S, Ounpuu S, Dans T, Avezum A, Lanas F, McQueen M, Budaj A, Pais P, Varigos J, Lisheng L, Effect of potentially modifiable risk factors associated with myocardial infarction in 52 countries, 2004, Lancet 364 (9438), page no. 937–52.
- Deepa M, Farooq S, Deepa R, Manjula D, Mohan V. Prevalence and significance of generalized and central body obesity in an urban Asian Indian population in Chennai, India Eur J Clin Nutr. 2009, Vol. 63(2), page no. 259-267.
- Misra A, Pandey RM, Devi JR, Sharma R, Vikram NK, Khanna N. High prevalence of diabetes, obesity and dyslipidaemia in urban slum population in northern India. International Journal Obesity Related Metabolic Disorders, 2001, Vol. 25(11), page no. 1722-1729.
- Carey D.G.P. Abdominal obesity.current opinion in lipidology, 1998, Vol. 9(1), page no.35- 40.
- Yusuf S, Hawken S, Ounpuu S, Dans T, Avezum A, Lanas F, McQueen M, Budaj A, Pais P, Varigos J, Lisheng L, Effect of potentially modifiable risk factors associated with myocardial infarction in 52 countries, 2004, Lancet 364 (9438), page no. 937–52.
- Razay, George, Abdominal obesity and alzheimer’s disease, dementia & genetic cognitive disorders, July 2006.
- American Journal of Hypertension, 10-year study of Chinese adults published in the August 2006.
- Poehlman, Eric T. Abdominal obesity: the metabolic multi-risk factor, 1998, Vol.9 (8), page no. 469–471.
- Dalia M. Kamel et al. Effect of abdominal versus pelvic floor muscle exercises in obese Egyptian women with mild stress urinary incontinence, Hong Kong Physiotherapy Journal 2013, Vol.31, page no. 12-18.
- http://www.nfhsindia.org/nfhs3.html. Accessed on 6 March, 2012
- Gupta R, Gupta VP. Obesity is major determinant of coronary risk factors in India, Indian Heart Journal, 2008, Vol.60, page no. 26-33.
13).Ramachandran A, Snehalatha C. Rising burden of obesity in Asia, Journal of Obesity, 2010
- Gupta S, Kapoor S. Sex differences in blood pressure levels and its association with obesity indices: Who is at greater risk, Ethn Dis, 2010, Vol.20, page no.370-5.
- Garg C, Khan SA. Prevalence of obesity in Indian women, Obes Rev, 2010, Vol.11, page no.105-8.
- Yajnik CS, Ganpule-Rao, The obesity-diabetes association: What is different in Indians? International Journal Low Extremity Wounds, 2010, Vol.9, page no. 113-5.
- Pandya H, Lakhani JD, Patel N, Obesity is becoming synonym for diabetes in rural areas of India also-an alarming, International Journal Biol Med Research, 2011, Vol.2, page no.556-60.
- Freidman and Eisen 2005, page no.16
- T Murphy, Lyles, Demons, Lenchik, Nicklas, Addition of aerobic exercise to dietary weight loss preferentially reduces abdominal adipocyte size, International Journal of Obesity,2006, Vol. 30 (8), page no. 1211–6.
- J Korean Academy Community Health Nursing, 2011, Vol.22(4), page no. 451-457.
- Jorge Perez-Gomez, Germán Vicente-Rodríguez, Ignacio Ara Royo, Diana Martínez- Redondo, José Puzo Foncillas, Luis A. Moreno, Carmen, Díez-Sánchez and José A. Casajús1, Effect of endurance and resistance training on regional fat mass and lipid profile, Nutr Hosp, 2013, Vol.28(2), page no.340-346.
- Kim JH, Noh JC, Kang SJ, Effects of aerobic and resistance exercise on insulin resistance, C-reactive protein, physical fitness in middle-aged women with metabolic syndrome, Health & Sports Medicine, 2013, Vol.15(2), page no.81-91.
- Ibanez J, Izquierdo M, Arguelles I, Forga L, Larrion JL, Garcia- Unciti M, Idoate F, Gorostiaga EM. Twice-weekly progressive resistance training decreases abdominal fat and improves in- sulin sensitivity in older men with type 2 diabetes, Diabetes Care, 2005, Vol.28, page no.6627.
- Ross R, Dagnone D, Jones PJ, et al. Reduction in obesity and related comorbid conditions after diet-induced weight loss or exercise-induced weight loss in men, Ann Intern Med, 2000,Vol.133, page no.92–103.
- Lee S, Kuk JL, Davidson LE, et al. Exercise without weight loss is an effective strategy for obesity reduction in obese individuals with and without type 2 diabetes, J Appl Physiol, 2005, Vol.99, page no.1220–5.
- Giannopoulou I, Ploutz-Snyder LL, Carhart R, et al. Exercise is required for visceral fat loss in postmenopausal women with type 2 diabetes, J Clin Endocrinol Metab, 2005, Vol.90, page no.1511–18.
- Mourier A, Gautier J-F, Kerviler ED, et al. Mobilization of visceral adipose tissue related to the improvement in insulin sensitivity in response to physical training in NIDDM: effects of branched-chain amino acid supplements, Diabetes Care, 1997, Vol.20, page no.385–91.
- Sigal RJ, Kenny GP, Boule NG, et al. Effects of aerobic training, resistance training or both on glycemic control in type 2 diabetes, Ann Intern Med 2007,Vol.147, page no.357–69.
- Ryan AS, Hurlbut DE, Lott ME, Ivey FM, Fleg J, Hurley BF, Goldberg AP. Insulin action after resistive training in insulin resistant older men and women, J Am Geriatr Soc 2001, Vol.49, page no.247-53.
- Misra A, Alappan NK, Vikram NK, Goel K, Gupta N, Mittal K, Bhatt S, Luthra K. Effect of supervised progressive resistance- exercise training protocol on insulin sensitivity, glycemia, lip- ids, and body composition in Asian Indians with type 2 diabe- tes. Diabetes Care 2008, Vol. 31, page no.1282-7.
- Sigal RJ, Kenny GP, Boule NG, Wells GA, Prud‟homme D, For- tier M, Reid RD, Tulloch H, Coyle D, Phillips P, Jennings A, Jaffey J. Effects of aerobic training, resistance training, or both on glycemic control in type 2 diabetes, Ann Intern Med 2007, Vol.147, page no.357-69.
- Patterson RM, Stegink Jansen CW, Hogan HA, Nassif MD. Material properties of Thera- Band Tubing, Phys Ther 2001, Vol.81, page no.1437-45.
- Hughes CJ, Hurd K, Jones A, Sprigle S. Resistance properties of Thera-Band tubing during shoulder abduction exercise, J Orthop Sports Phys Ther 1999, Vol.29, page no.413-20.
- Salvi Shah, Pilates Exercises, International Journal of Physiotherapy and Research, 2013, Vol. 1 (4), page no.196-203
- Carolyn Kisner and Lynn Allen Colby, Therapeutic Exercises 5th Edition, Chapter-6 , Page No. 149
- The Pilates method book, retrieved 2 February 2011
- Friedman and Eisen, 2005, page no. 13
- Suzanne Farrell, cited in Freidman and Eisman, 2005, page no. 15
- Friedman and Eisen, 2005, page no. 15
- Romana Kryzanowska cited in Freidman and Eisen, 2005, page no. 16
- Return to Life through Contrology, Bodily house-cleaning through circulation, page no. 14
- Romana Kryzanowska cited in Friedman and Eisen, 2005, page no. 17
- Wiliams and Wikins et al. ACSM‟s health related physical fitness assessment manaual, 2nd edition, chapter 4, page no. 64-65
- Alexandre Wesley Carvalho Barbosa et al. The Pilates breathing technique increases the electromyographic amplitude level of the deep abdominal muscles in untrained people, Journal of Bodywork & Movement Therapies, 2015, Vol. 19, page no.57-61.
- Jamil Natour et al. Pilates improves pain, function and quality of life in patients with chronic low back pain, Clinical Rehabilitation 2015, Vol. 29(1), page no.59 –68.
- Devon A Dobrosielski et al. Effect of exercise on abdominal fat loss in men and women with and without type 2 diabetes, BMJ Open 2013, Vol.3, page no.3897.
- M Fourie et al. Effects of a Mat Pilates Programme on Body Composition in Elderly Women West Indian Med J 2013, Vol.62(6), page no.524.
- Dalia M. Kamel et al. Effect of abdominal versus pelvic floor muscle exercises in obese Egyptian women with mild stress urinary incontinence, Hong Kong physiotherapy journal 2013, Vol.31, page no.12-18.
- Evrim Cakmaker Effects of 10 weeks pilates mat exercises program on weight loss and body composition for overweight Turkish women, World Applied Sciences Journal 2012, Vol.19(3), page no.431-438.
- Mr. S. Venugopal et al. Effects of Pilates Training and Yogic Training with and without Combination on Selected Physical Fitness Components among College Level Obese Students, Indian Journal Of Research 2012, Volume : 1 Issue : 9, page no. 2250-1991.
- Pardis Noormohammadpour et al. The effect of abdominal resistance training and energy restricted diet on lateral abdominal muscles thickness of overweight and obese women, Journal of body work and movement therapies 2012, Vol. 16 Issue 3, page no. 344-35.
- SoJung Lee et al. Effects of aerobic versus resistance exercise without caloric restriction on abdominal fat, intrahepatic lipid, and insulin sensitivity in obese adolescent boys, Diabetes 2012, Vol.61, page no.2787-2795.
- Ian A.F. Stokes et al. Abdominal muscle activation increases lumbar spinal stability , NIH Public Access , Clin Biomech (Bristol, Avon) 2011, Vol. 26(8), page no.797–803.
- Duncan J. Critchley et al. Effect of pilates mat exercises and conventional exercise programmes on transversus abdominis and obliquus internus abdominis activity, Manual therapy 2011, Volume 16, Issue 2, Page no. 183–189.
- Barbara Strasser, Uwe Siebert and Wolfgang Schobersberger et al. Resistance Training in the Treatment of the Metabolic Syndrome 2010, Vol. 40 (5), page no.397-415.
- Hwi Ryun Kwon et al. The Effects of resistance training on muscle and body fat mass and muscle strength in type 2 diabetic women, Korean Diabetes Journal 2010, Vol.34, page no.101- 110.
- Cris A. Slentz Joseph A. Houmard and William E. Kraus et al. Exercise, abdominal obesity, skeletal muscle, and metabolic Risk: evidence for a dose response, Obesity Silver Spring 2009, Vol.17(03), page no.S27–S33.
- Suoma E. Saarni et al. Association of Smoking in Adolescence With Abdominal Obesity in Adulthood, American Journal of Public Health, 2009, Vol 99, Issue No.2.
- Y Ye et al. Identification of waist circumference cutoffs for abdominal obesity in Chinese population, International Journal of Obesity 2009, Vol.33, page no.1058-1062.
- Crystal Man Ying Lee et al. Indices of abdominal obesity are better discriminators of cardiovascular risk factors than BMI, Journal of Clinical Epidemiology 2008, page no.646-653.
- Betu l Sekendiza et al. Effects of Pilates exercise on trunk strength, endurance and flexibility in sedentary adult females, Journal of Bodywork and Movement Therapies 2007, Vol. 11, page no.318–326.
- Betul Sekendiz et al. Effects of pilates exercises on trunk strength, endurance and flexibility in sedentary adult females, Journal of Bodywork and Movement Therapies 2007, Vol. 11, page no.318-326.
- Bryan J. Taylor et al. Exercise-induced abdominal muscle fatigue in healthy humans, J Applied Physiology 2006, Vol. 100, page no.1554 –1562.
- Aviva Must, Jennifer Spadano, Eugenie H. Coakley, Alison E. Field, Graham Colditz, William H. Dietz et.al The disease burden associated with overweight and obesity.
TO COMPARE THE EFFECT OF MAT EXERCISE AND GYM BALL EXERCISES REGIMENS ON TRUNK CONTROL AND FUNCTIONAL BALANCE IN PATIENTS WITH CHRONIC STROKE
Pritesh Prajapat Shailendra Mehta
INTRODUCTION
Stroke is the most common life threatening neurological disease. According to WORLD HEART FEDERATION every year 15 million people worldwide suffer from stroke, nearly 6 million die and 5 million left disabled. About 1.2% of deaths in India are due to stroke, the incidence is 105 per 1 lakh population in urban community and 262 per lakh in rural community.1 Among the non communicable diseases stroke contributes for 41% of deaths and 72% of disability as estimated by Indian council of medical research. Common problems after stroke are impaired motor functions including balance and gait disturbances.2 The trunk being the central key point of the body, proximal trunk control is a pre requisite for distal limb movement control, balance and functional activities.3
NEED OF THE STUDY
Various studies have demonstrated the effects of therapeutic approaches used after stroke for example neurophysiologic, motor learning, strengthening exercises of limb muscles etc. But the evidence supporting the effectiveness of trunk rehabilitation and balance training is scarce.
AIM OF THE STUDY
The aim of the study was to investigate the comparative efficacy of the two interventions mentioned above in improving trunk control and functional balance using the Berg balance scale and Trunk control test, respectively.
OBJECTIVE OF THE STUDY
The objective of the study was to determine whether exercises performed on a physio ball are more beneficial than those performed on a mat for trunk control and functional balance in patients with chronic stroke.
METHODOLOGY AND MATERIAL USED
STUDY DESIGN – A comparative study
SAMPLE DESIGN – Convenient sampling
PLACE OF STUDY – Active life physiotherapy center.- Niyantaa physiotherapy clinic.
MATERIAL USED
- Gym ball
- Mat
- Pen.
- Camera
- Examination chart for trunk control
- Pencil
- Water bowl
- Water
- Exercise chart
- Mirror
- Pillow
- Hand gloves
INCLUSION CRITERIA
- Patient having stroke.
- Paralysis of time duration more than 2 month and less than 1 year.
- Patient who have paresis.
- Both genders will be included.
- Patient who have given consent prior to the study.
- All patients who have understand my verbal instruction.
- Follow the chart of instruction and exercise provided by me.
EXCLUSION CERITERIA
- Time duration less than 1 month and more than 1 year.
- Patient having vital instability.
- Patient having allergy to various material used in treatment.
- Psychological disturb patient.
- Age after 70 years.
OUTCOME MEASUREMENTS
Primary outcome measurements – Berg balance scale
Secondary outcome measurements – Trunk control test
PROCEDURE
30 patient of chronic stroke between age group of forty to sixty five years have chosen on the basic of convenient sampling method –Subjects were divided into group A and group B each consisting of 15 patients receiving the intervention for 3 months.
Group A – Mat exercises for 90days 5 days in a week
Group B– Physio ball exercises for 90days 5 days in a week
All exercise had performed in different position like prone lying, supine lying, siting. Each subject was assessed according to -Berg balance scale and -Trunk control test.
Follow up asymmetry at rest during active facial movement was assessed on
- Day 0 before starting the treatment.
- Day 45 during the treatment.
- Day 90 at the end of treatment.
GROUP- A
Total treatment time was around 60 minutes per session.
1. Bridging on mat | – 10 min. |
2. Unilateral bridging | – 10 min. |
3. Quadripod position | – 10 min. |
4. Kneeling | – 10 min. |
5. Half kneeling | – 10 min. |
6. Sitting without support | – 10 min |
GROUP – B
Total treatment time will be around 45 minutes per session.
SUPINE EXERCISE ON GYM BALL
- Bridging exercise on gym ball -5 min
- Unilateral bridging on gym ball – 5 min
- SITTING EXERCISE ON GYM BALL
1. Flexion –extension on trunk | -5 min. |
2. Lateral flexion on trunk | -5 min. |
3. Rotation of trunk | -5 min. |
4. Rotation of trunk right to left | -5 min. |
5. weight shift right to left | -5 min . |
6. Lateral reach exercise | -5 min. |
7. Sitting balance exercise | -5 min |
RESULTS
After screening of the 50 patients for study eligibility, a total of 30 patients were included for analysis, of whom 15 were in the control group (physio plinth) and 15 were in the experimental group (physio ball).Outcome measures between the experimental
Table 1 shows the comparison of scores for trunk control test between Group A and Group B.
Table 1
- BETWEEN GROUPS:
TRUNK CONTROL TEST (TCT):
Group | Mean | N | SD | Std. Error Mean | Mean Diff | T | P | |
TCT PRE-TEST | A B | 45.67 53.13 | 15 15 | 13.431 9.716 | 3.468 2.509 | 7.46 | 1.745 | 0.092NS |
NSNon-significant difference
Group | Mean | N | SD | Std. Error Mean | Mean Diff | T | P | |
TCT POST-TEST | A B | 64.53 68.27 | 15 15 | 10.120 9.445 | 2.613 2.439 | 3.74 | 1.045 | 0.3052NS |
NSNon-significant difference
Table 2 shows the comparison of scores for Berg Balance test between Group A and Group B.
Table 2
BETWEEN GROUPS:
BERG BALANCE SCALE (BBS):
Group | Mean | N | SD | Std. Error Mean | Mean Diff | T | P | |
BBS PRE-TEST | A B | 23.87 22.73 | 15 15 | 6.523 3.918 | 1.684 1.012 | 1.14 | 0.5768 | 0.5687NS |
NSNon-significant difference
Group | Mean | N | SD | Std. Error Mean | Mean Diff | T | P | |
BBS POST-TEST | A B | 34.47 31.40 | 15 15 | 7.210 5.409 | 1.862 1.397 | 3.07 | 1.318 | 0.1983NS |
NSNon-significant difference
Table 3 shows the mean differences between Group A and Group B for the scores of Trunk Control test and Berg Balance test.
Table 3
- MEAN IMPROVEMENT IN TCT AND BBS VALUES IN GROUPS:
Group | N | Mean | Group | N | Mean | ||
TCT Pre-test to Post-test | A B | 15 15 | 18.86 15.14 | BBS Pre-test to Post-test | A B | 15 15 | 10.60 8.67 |
DISCUSSION
The aim of the study was to determine whether exercises performed on a physio ball are more beneficial than those are performed on a mat for trunk control and functional balance in patients with chronic stroke.
To the best of our knowledge, this study is the first of its kind using a physio ball, the dynamic treatment instrument for trunk rehabilitation in patients with acute stroke. Brunel Balance Assessment has been used for the first time as a functional balance outcome measure in an acute stroke intervention study.
A study on electromyography analysis observed that the anticipatory postural adjustment of trunk muscles activity is impaired in patients with stroke.28 Furthermore, there was a reduced recruitment of high threshold motor units of trunk muscles after stroke.9,10 These are, in fact, essential for reactive postural adjustments during external perturbation.29 The possible reason for better trunk control improvement in the experimental group may be that the movement of the physio ball beneath the patients provides a postural perturbation in a gravitational field to which the trunk muscles respond reactively in order to maintain the desired postural stability.
A study by Verheyden et al.18 found that 10 hours of additional trunk exercises along with regular physiotherapy improved the lateral flexion of trunk in patients with subacute stroke. In our study it was observed that difference in effect between the two interventions (trunk exercises on the physio ball vs. those on the plinth) was 1.47 for the dynamic sitting balance subscale, which may be compared with the observed mean difference of 2.22 between the two interventions (trunk exercises on the plinth as against regular physiotherapy) in the study done by Verheyden et al. Although the change score between the groups was slightly lower in
our study than indicated by earlier trunk research, a greater improvement (4.07) was observed in our experimental group (i.e. those who performed trunk exercises on the physio ball) than the improvement (3.47) observed in the experimental group (i.e. those who performed trunk exercises on the plinth) of the study undertaken by Verheyden et al. An interesting finding was the trunk rotation improvement (i.e. horizontal plane dynamic postural control) as measured by the coordination subscale of the Trunk Impairment Scale. Coordination of the trunk is the mobility over stability task which requires counter rotation between the upper and lower trunk.
Furthermore, the better weight shift ability towards the hemiplegic side is essential for coordination of the trunk, particularly for the lower trunk rotation.15,16 Clinical observation also suggests that the rotation of the lower part of the trunk is more difficult for stroke patients.11 Recent studies on posturographic analysis observed that stroke patients tend to avoid shifting their centre of pressure towards the hemiplegic side in sitting29 and standing.30
A study by Mudie et al.31 found that training the patient in the awareness of trunk position could improve weight symmetry in sitting after the early phase of the stroke. The probable reason for the significant trunk rotation improvement may be the improved weight shift ability with the physio ball training.
Furthermore, the trunk training performed on the plinth involves the same exercises as physio ball training, but the inadequacy of plinth training acting on coordination would only be due to lack of postural perturbation. The effect size index (2.2) for the coordination subscale of the Trunk Impairment Scale is in favour of the experimental group.
Another exciting finding of this study was that trunk exercises performed on the physio ball had a carry-over effect in improving functional balance such as standing and stepping. The greater effect size index observed in
the total Brunel Balance Assessment (1.3) and the stepping component of the Brunel Balance Assessment (1.2) support our study hypothesis.
Dean et al.31,32 demonstrated an improvement in standing balance following dynamic reaching tasks undertaken for objects beyond arm’s length when the patient was in the sitting position. Experts in the field of neurological rehabilitation have addressed the trunk as the central key point of the body.
The neurodevelopmental treatment principle states that the control of movement proceeds from proximal to distal body regions. Proximal stability of the trunk is a prerequisite for distal limb movement.15,16
Therefore, proximal trunk control improvement influences the functional balance involved in activities such as standing and stepping. A recent cross-sectional study by Verheyden et al.17 favours this hypothesis. In their study, there was a positive association found between trunk control and balance after an acute stroke.According to Tyson,34 people with acute stroke progressing from one level to another level is of clinical importance for the Brunel Balance Assessment. In our study, the physio ball group had advanced almost two levels more than the control group, and this may affirm a factual clinical importance for Brunel Balance Assessment. Patients with acute stroke treated with the physio ball were able to walk 5m without an aid in one minute, which means they could change the base of support between double and single stance. The reason for the significant stepping balance improvement using the physio ball intervention may be an improvement in lower trunk muscle control which is essential for the stabilization of the pelvis. If an improved level of proximal pelvic stability is attained, a better distal lower extremity mobility might be anticipated, such as that involved in stepping balance.A study involving analysis of trunk kinematics in stroke subjects found unstable and asymmetrical pelvic movements during walking.35 A study on posturographic analysis of trunk movements also confirmed that these movements are executed by the upper trunk with very little lower trunk (pelvic movement) after stroke.36
An intervention study by Trueblood et al.37 gives further support to this hypothesis. In their study, proprioceptive neuromuscular facilitation (PNF)-based resisted anterior elevation and posterior depression of pelvic movements for lower trunk muscles resulted in an improvement in walking in early phase stroke patients. The study findings are of clinical importance for the treatment of dynamic sitting balance, coordination of the trunk, standing and stepping balance in patients with acute stroke who are able to sit independently for 30 seconds. Inclusion of the dynamic treatment equipment may thus be considered to have not only a beneficial task-specific effect on the selective trunk movement control of lateral flexion and rotation, but also a carry-over effect on functional balance in the comprehensive rehabilitation of acute stroke care. Holden et al, reported that the amount of physical assistance needed for functional ambulation was significantly related to measures of stride length, step length and cadence. It was suggested that these measures were meaningful in measuring treatment outcomes in hemiplegic patients. So in this study we have taken stride length, step length and cadence as gait parameters.17, 18
Trunk impairment scale is the clinical scale used to assess the trunk control in static and dynamic sitting balance and trunk co-ordination. This is a sensitive tool to assess the sitting balance in acute stroke subjects Hemiparesis is the most frequent neurological deficit after stroke. Hemiparetic stroke patients frequently present with balance and gait abnormalities. Trunk control requires appropriate sensorimotor ability of the trunk in order to provide a stable foundation for balance functions in
patients with stroke. Another abnormality that can be seen in stroke subjects is gait. It is characterized by slow gait speed, poor endurance and adaptability of walking Pattern. Walking speed is widely used as an indicator of gait performance on Stroke. Several studies have related that there will be impaired walking speed in stroke subjects due to muscle weakness, spasticity and impaired balance. Although the majority of stroke patients achieve independent gait but they may not reach the level that enables them to perform all their daily activities.
LIMITATIONS OF THE STUDY
1. Exercise program is difficult to understand by the subjects.
2. Small sample size was taken, Language problem was observed in scale measurement.
3. The study was limited due to shorter duration of treatment.
4. The study was limited age group between 40 – 70 years.
5. The study was limited to only trunk control and function balance in chronic stroke patients.
2. RECOMMENDATIONS FOR FURTHER STUDY
- It may be recommended that treatment course could be more than 12 weeks, so that more results could be evaluated.
- Future studies, conducted by randomized control trials with the help of other outcome measures which may also conclude, the patient will become more independent
- It may be recommended that study could be done on more than 30 chronic stroke patients with trunk control and functional balance impairment.
- It may be recommended that study could be done on different age groups.
- It may be recommended that more studies are needed to be done in single techniques to improve trunk control and functional balance in chronic stroke patients.
- It may be recommended that study could be done in acute and subacute stroke patients.
- Future studies could be directed at identifying appropriate pathological groups and patient profiles that would most benefit from a cost-effective exercise program in community level.
CONCLUSION
The aim of the study was to determine whether exercises performed on a physio ball are more beneficial than those are performed on a mat for trunk control and functional balance in patients with chronic stroke. The results showed that trunk exercises performed on the physio ball are more effective than those on the mat for improving lateral flexion and rotation of the trunk as measured by trunk control test and berg balance test, respectively. Furthermore, the physio ball group showed greater improvement in functional balance.
A study by Mudie et al31 found that training the patient in the awareness of trunk position could improve weight symmetry in sitting after the early phase of the stroke. The probable reason for the significant trunk rotation improvement may be the improved weight shift ability with the physio ball training.
Clinical observation also suggests that the rotation of the lower part of the trunk is more difficult for stroke patients.11 Recent studies on posturographic analysis observed that stroke patients tend to avoid shifting their centre of pressure towards the hemiplegic side in sitting29 and standing.30
REFERENCE
- Ryerson S, Byl N, Brown D, Wong R and Hidler J. Altered trunk position sense and its relation to balance functions in people post- stroke. J Neurol Phys Ther 2008; 32: 14–20.
- Karatas M, Cetin N, Bayramoglu M and Dilek A. Trunk muscle strength in relation to balance and functional disability in unihemispheric stroke patients. Am J Phys Med Rehabil 2004; 83: 81–87.
- Verheyden G, Nieuwboer A, Mertin J, Preger R, Kiekens C and De Weer dt W. The trunk impairment scale: a new tool to measure motor impairment of the trunk after stroke. Clin Rehabil 2004; 18: 326–334.
- Fujiwara T, Sonoda S, Okajima Y and Chino N. The relationships between trunk function and the findings of transcranial magnetic stimulation among patients with stroke. J Rehabil Med 2001; 33: 249–255.
- Dickstein R, Heffes Y, Laufer Y and Ben-Haim Z. Activation of selected trunk muscle during symmetric functional activities in post stroke hemiparetic and hemiplegic patients. J Neurol Nurosurg Psychiatry 1999; 66: 218–221.
- Tsuji T, Liu M, Hase K, Masakado Y and Chino N. Trunk muscles in persons with hemiparetic stroke evaluated with computed tomography. J Rehabil Med 2003; 35: 184–188.
- Bohannon RW, Cassidy D and Walsh S. Trunk muscle strength is impaired multidirectionally after stroke. Clin Rehabil 1995; 9: 47– 51.
- Bohannon RW. Lateral trunk flexion strength: impairment, measurement reliability and implications following unilateral brain lesion. Int J Rehabil 1992; 15:249–251.
- Tanaka S, Hachisuka K and Ogata H. Muscle strength of the trunk flexion-extension in post-stroke hemiplegic patients. Am J Phys Med Rehabil 1998; 77: 288–290.
- Tanaka S, Hachisuka K and Ogata H. Trunk rotator muscle performance in post-stroke hemiplegic patients. Am J Phys Med Rehabil 1997; 76: 366–369.
Systemic Sclerosis — A polysegmental Reflex Dystrophy Treated by Matrix Rhythm Therapy.
Case Report Seven Years After Diagnosis
U.G. Randoll 1; Y. Largiadèr 2
1 Dr.-Randoll-Institut, Lortzingstraße 26; 81241 Munich; Germany
2 Clinic Dr. Y. Largiadèr; Emil-Geis-Straße 4, 82031 Grünwald; Germany www.Dr-Randoll-Institut.de
Introduction:
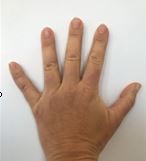


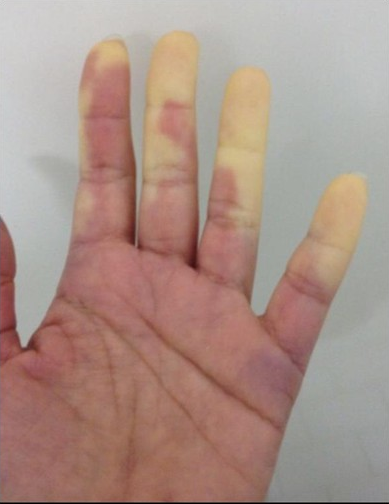
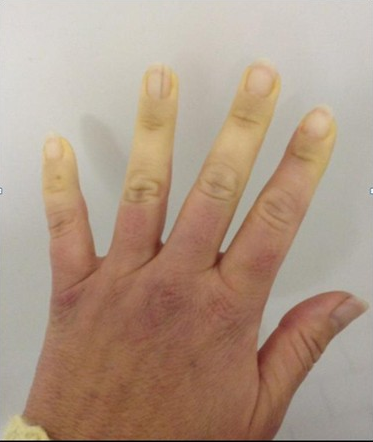
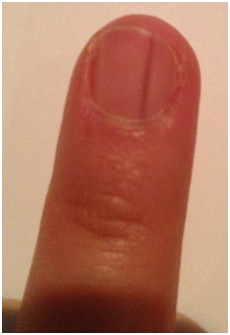
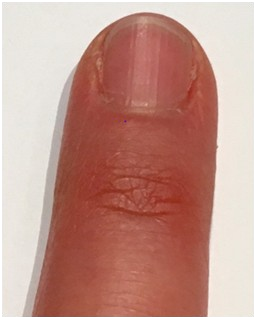
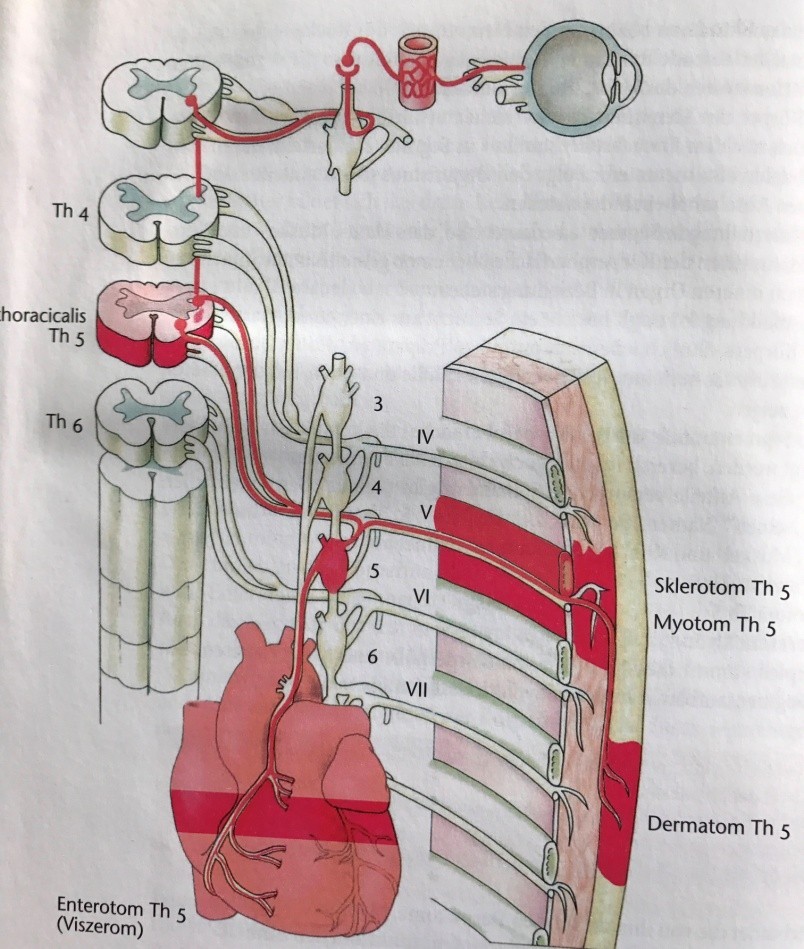
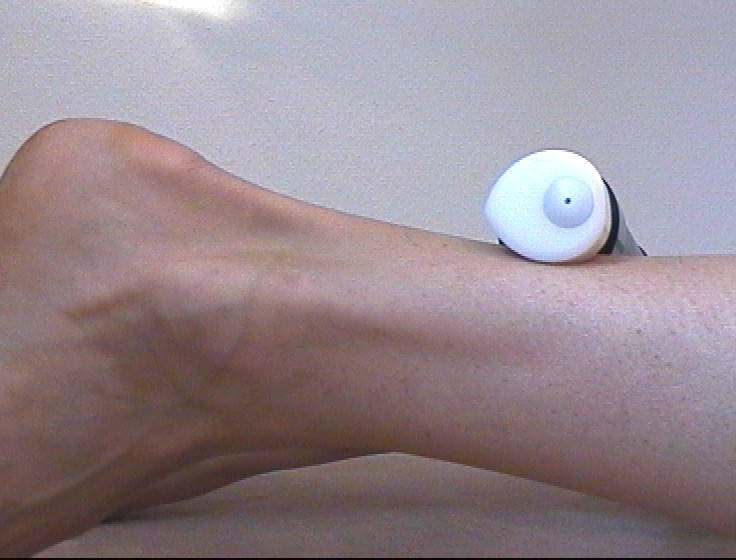

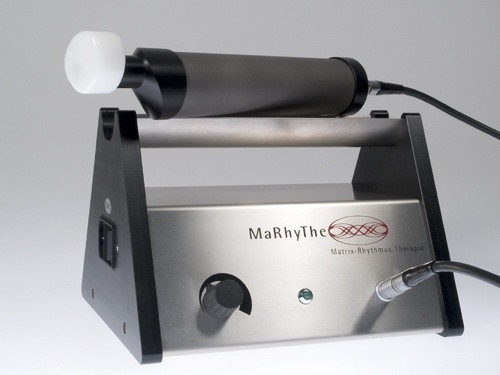
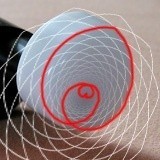
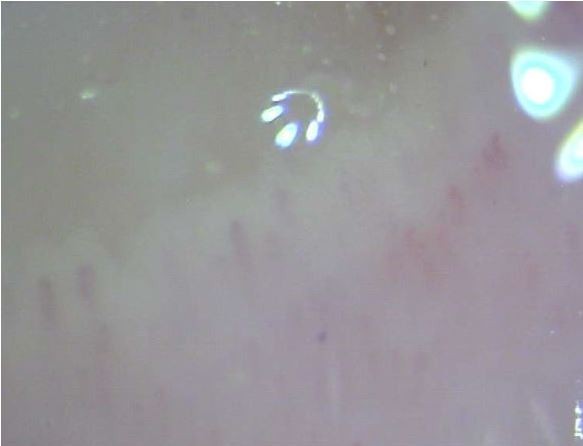
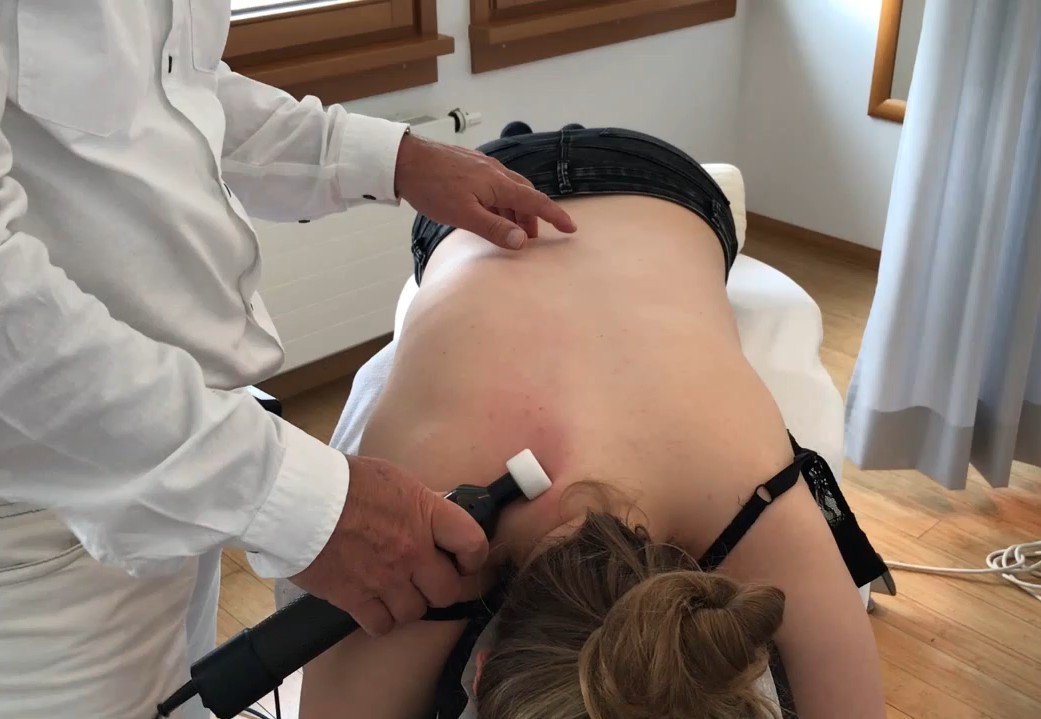
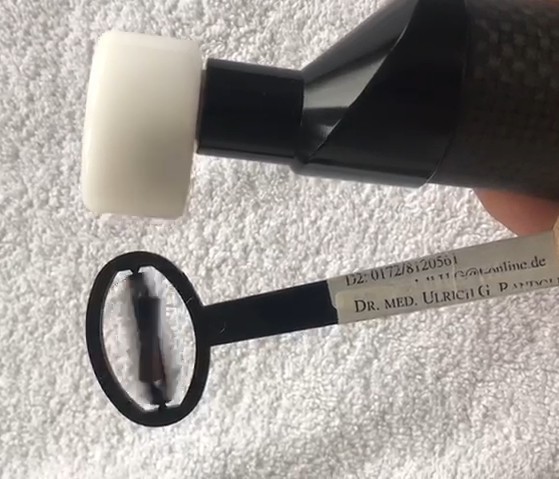
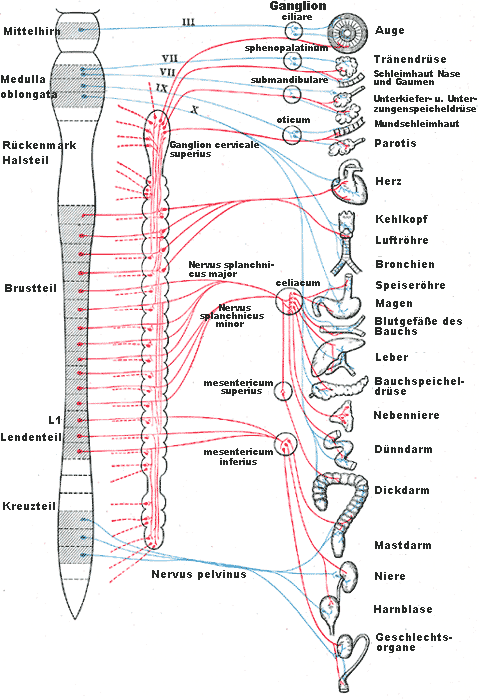

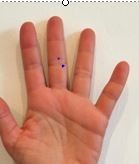
The female patient, born 1970 was suffering from sporadically Raynaud Phenomenon ( RP) of both hands and feet since 2003 . 2010 these symptoms increased. RP was triggered from stress and ambient temperature below 22°C. Fingers be- came swollen additionally.
2012 this formerly sporty patient became more and more ex- hausted gained weight more than 10 kg in a short time be- cause of physical inactivity. Back pain began and the whole thorax lost flexibility and elasticity as well.
2013 she consulted specialists at different clinics who diag- nosed in unison limited Systemic Sclerosis ( l SSc ) with be- ginning osteopenia and already affected esophagus.
Standard Treatment until 2014:
She had regular infusions with Ilomedin. After the third cycle Ilomedin was stopped in 2013 and therapy switched to 5mg Tadalafil orally per day until end of 2014. As symptoms did not change under this therapeutic regiment she was still searching on for other treatment options.
Findings and Diagnosis 2013:
- ANA-Titer 1:10.000; ACA positive, Nucleons negative, chromosomes positive.
- Raynaud Phenomenon
- Capillaroscopy: scleroderma active pattern, typical megacapillaries
- Puffy hands
- Pain and decreased ROM in the metacarpale joints
- Problems when swallowing
- Esophagus passage delayed overall, retention of the test dish in the upper and middle third of esophagus ( medium grade restriction of contractility )
- Elevated calprotectin concentration in stool samples 112,1 µ /g ( <50 µg )
Fig. 1: Capillaroscopy 2014-01-31 ( dig IV right hand ) : scleroderma active pattern. Typical megacapillaries ( x200)
Fig. 2,3,4: 2012 the fingers showed Raynaud Phenomenon at ambient temperature below 22°C.
The finger nail ( D ig. III left hand ) presented with splinter hemorrhage.
Prognosis:
The short and long term prognoses she was given by her doc- tors in those days where hard to accept.
- During wintertime she need regular infusion of Ilomedin
- The rest of the year she is obliged to take Tadalafil
- Parallel she should take Bosentan
- The worst recommendation was the to quit her job and to move into warmer countries. Etc.
New treatment concept after changing the view
Anamnestic we got the information that our patient was claim- ing stress and emotional strain a long time. From a certain age on she got immediate symptoms when her sympathetic sys- tem was even triggert unspeciffically. So it was clear, that Ma- trix Rhythm Therapy could help.
Matrix Rhythm Therapy
Matrix Rhythm Therapy is a medical treatment based on the so-called entrainment effect in living systems and is focusing the “logistics ” around the cells and reduces the sympathetic load on one ’ s body as well.
The term “ entrainment ” refers to the way processes in cells, organs and entire organisms can be synchronized by exter- nally-applied rhythmical action.
Effect of Matrix Rhythm Therapy: Resetting and
reorganizing by Entrainment of the whole living system:
- It is the synchronization of cells, organs, organisms by external
rhythms (time pattern).
- With physiological rhythms/vibrations (frequency window of 8 -12
Hz) we readapt physiological processes.
- External rhythms (“crank handle”) engage internal rhythms, to arrange them and their corresponding metabolic processes as well.
Fig. 5: The physiological effects of Matrix Rhythm Therapy
Matrix Rhythm Therapy exploits the natural rhythms of the musculature and nervous system in order to restore the coher- ence of derailed body processes. The therapy utilizes a spe- cial device, the Matrixmobil, which gently stimulates the
body ’ s endogenous vibrations by means of rhythmical me- chanical and magnetic action in the physiological frequency range of 8-12 Hz ( Alpha Synchronizer ) .
Matrix-Rhythm-Therapy (MaRhyThe),
Is a deep penetrating effective, rhythmic micro-extension technique
A specially designed resonator mechano-magneticically stimulates the physiological vibrations, especially of the skeletal muscles and the nervous system. (8-12 Hz)
Result: Normalization of cellular rhythms as well as nutrient flux density in extracellular space.
(“synchronous cooperation” and “coupling of oscillators”)
Fig. 6: The Matrixmobil and its treatment effects
This coincides with the natural frequency range of the microvi- brations of our skeletal musculature. By activating especially the skeletal musculature in the rhythmic frequency range 8-12 Hz, the logistics of supply and drainage of tissue improves metabolic conditions in and around the cells are normalizing.
In this case Matrix Rhythm Therapy, targeting stress and emotional strain as the chief causes of systemic sclerosis helped.
Treatment of Systemic Sclerois via sympathetic Tunc
Fig. 7: Treating the paravertebral spine deeply in the reso- nance frequency of 8-12 Hz normalizes the sympatho vagal balance of body and mind.
Result
It was the year 2014 when for the first time she got a whole body Matrix Rhythm Therapy especially along her sympathetic trunk. Immediate results were seen. So we stopped all reme- dies!
Sleep quality increased; she developed a temperature resis- tance so that RP disappeared more and more. Life quality came back. Since that time she gets regularly Matrix Rhythm Therapy and whole body lymph drainage once a week, stress management beside physical activity / work out in aerobe con- dition. As supplements she takes linseed oil, Curcuma and ReGenery — kind of flavor extract — to stabilize her micro- biom for strengthening the immune system.
Findings and Diagnosis 2020
- ANA-Titer below 1:3.200, ACA positive, Nucleons negative, chromosomes positive
- No Raynaud-Phenomenon any more
- Capillaroscopy: No active pattern, no megacapillaries
- No puffy hands
- No pain and decreased ROM in the metacarpale joints
- No problems when swallowing
- Esophagus passage without any symptoms
- Calprotectin concentration in stool samples 36 µ /g ( <50 µ /g )
Conclusion and prognosis
Since 2015 till today the patient is nearly free of symptoms and free of any medication. She is still working full time even using her fingers 8 hours a day.
Fig. 8: Capillaroscopy 2019-10-11 ( dig IV right hand ) : capillary ectasies. No megcapillaries ( x200)
Fig. 9: 2019 the patient is free of symptoms. The fingernail ( D ig. III ) turned to normal. Without splinter hemorrhage
Pathomechanism from point of Neural system
We hypothesize that according to the structural design of “ S egment Anatomy ” of the human body, the nerves of
every organ interact with the “ N eurotome ” . As a result of re- flex dystrophies – similar in Sudeck Syndrome – silent inflam- mations of the interstitial tissue appear randomly in the irri- tated segments and cause successively individual fibrosis and later sclerosis in corresponding organs of Sclerotome,
Myotome, Viscerotome, Dermatome. We call it “ P olysegmental Reflexdystropy ” .
Segment – Anatomy
Basis for C.S. Sherrington, Nobel prize 1932
- Acupuncture,
- Neuraltherapy,
- Manualtherapy
- Matrix Rhythm Therapy as part of Matrix Concept
It is the eldest concept of the architecture of the evolution
-
- forming health and disease, mind and the soma.
- It is the unconscious social stimuli for our spontaneous
behavior.
-
- It is forming our “language of vertebrates”
Segments, Metamers and Antimers for diagnostics
-
-
- Segments are parts of an organism with an outer
-
envelope and inner organs.
-
-
- Metamerie means one after another to construct the human body.
- the number of segments is equal to the number of
-
spinal nerves of an individual.
-
-
- Antimerie means right and left side of the body acc.
-
to left and right spinal nerve
Segments and Metamers show the interaction between
surface and inner body.
N. Thoracicalis Th5
TH5 with parts of dermatome, myotome, sclerotome, enterotome and spinal nerve as an example of interactions and projections between body surface and inner body.
(Hansen/Schliack)
Result from such reflexes?
- all segments are in nervous activity state
- the neurotome – as central one – is always activated
- derailments from inner organs project on body surface (pain) as well as motoric or vegetative reflexes and produce symptoms
The sympatho-vagale Balance shifts; and amplitude Stress level is rising!
Which “drop” causes the barrel to overflow? the sympathetic load increases immunsystem is chronically activated and later blocked
Discussion
The fact is that in modern society people fail to maintain a proper sympato-vagal balance in their lives. Frequently the need for rest and recovery periods is ignored, while at the same time emotional stresses continue to grow. “ Emotion translates into motion ” : emotional stress leads invariably to muscle contractions, which persist as a kind of “ memory ” . In the course of time muscle cells and the surrounding con- nective tissues lose their elasticity and ability to return to a completely relaxed state. They become hardened and stiff,
giving rise to symptoms in the skeletal, locomotor and nervous systems. Lack of body movement leads to emotional sluggish- ness, and conversely; the sympathetic load increases, the trunc shifts out of balance and healthy processes become blocked.
Our case indicates stress symptoms already in a very early state.
In the effort to counteract such “ degenerative and aging processes ” , systemic regenerative approaches are neces- sary: Emotional and physical blockages must be eliminated at the same time. Physician-patient dialog and Matrix Rhythm Therapy belong together, supplemented by music or other means to restore harmony in the physical and spiritual spheres. Healing of systemic sclerosis needs vagus!
Dr Randoll Institut Lortzingstrasse 26
82141 Munich
https://www.dr-randoll-institut.de/ u.randoll@dr-randoll-institut.de
